


Trusted by over 15 Million Traders
The Most Awarded Broker
for a Reason
Easy Access to 1,400+ Global Assets
EURUSD
Euro vs U.S. Dollar
US500
S&P 500 (US500)
GOLD
Gold
COFFEE
US Coffee
Apple
Apple (AAPL.OQ)
-

Finance Magnates 颁发
-

Finance Magnates 颁发
-

Capital Finance International Magazine (CFI.co) 2024年颁赠
-

COLWMA 2024年颁赠
-

荣获World Finance Forex Awards 2023最佳外汇客户服务奖
-

荣获World Finance Forex Awards 2023欧洲最佳外汇经纪商奖
-

荣获World Finance Forex Awards 2023澳大拉西亚最佳外汇经纪商奖
-

荣获World Finance Forex Awards 2023拉丁美洲最佳外汇经纪商奖
-

荣获World Finance Forex Awards 2023中东最佳外汇经纪商奖
-

CFI.co于2023年颁赠
-

荣获2023年City of London Wealth Management Awards
-

荣获2022年埃及金融博览会颁赠
-

荣获2022年City of London Wealth Management Awards
-

CFI.co于2022年颁赠
-

荣获Global Forex Awards 2022 — 零售外汇 颁赠
-
2021年迪拜外汇博览会获颁赠
-

Ultimate Fintech 2021年颁赠
-

荣获2021年City of London Wealth Management Awards
-

FX168于2020年12月颁赠
-

荣获Global Business Awards 2020
-

荣获2020年City of London Wealth Management Awards
-

Capital Finance International Magazine (CFI.co)颁赠
-

Capital Finance International Magazine (CFI.co)颁赠
-

荣获2019年City of London Wealth Management Awards
-

Shares Magazine 授予 UK Forex Awards 2018
-

Capital Finance International Magazine (CFI.co)颁赠
-

Capital Finance International Magazine (CFI.co)颁赠
-

2017年伦敦财富管理奖
-

2016最佳本土 客户服务
-

中东和北非地区(MENA)增长最快的经纪商
-
2015年最佳外汇科技提供商
-
2014年最佳外汇科技提供商
-

2014年最佳外汇科技提供商
-

荣获 The Trading Show 2024年非洲 Africa Fintech 峰会颁赠
-

荣获2024年中东地区 Brokersview 颁赠
-
荣获2024年中东地区 Brokersview 颁赠
-

荣获2024年阿曼 Smart Vision 峰会颁赠
-

荣获2024年迪拜外汇博览会颁赠
-

荣获2024年迪拜 Forex Traders Summit 颁赠
-

2024年埃及 Smart Vision 峰会颁赠
-

投查查于2024年颁赠
-

Capital Finance International Magazine (CFI.co) 2024年颁赠
-

CFI.co于2023年颁赠
-

CFI.co于2023年颁赠
-

交易社区平台FOLLOWME于2022年颁赠
-
2022年迪拜Forex Expo获颁赠
-
2022年迪拜Forex Expo获颁赠
-

荣获Global Forex Awards 2022 — 零售外汇 颁赠
-

CFI.co于2022年颁赠
-

CFI.co于2022年颁赠
-

World Finance Forex Awards 2022 颁发
-

World Finance Forex Awards 2022 颁发
-

World Finance Forex Awards 2022 颁发
-

World Finance Forex Awards 2022 颁发
-
交易社区平台FOLLOWME于2021年颁赠
-

2021年埃及Smart Vision Investment Expo博览会获颁赠
-

CFI.co于2021年颁赠
-

CFI.co于2021年颁赠
-

荣获Global Forex Awards 2021 — 零售外汇 颁赠
-

荣获Global Forex Awards 2021 — 零售外汇 颁赠
-

World Finance 2021颁发
-

World Finance 2021颁发
-
FOLLOWME于2021年颁赠
-

Global Forex Awards 2021 — B2B 颁赠
-

Global Forex Awards颁赠
-

Global Forex Awards颁赠
-

CFI.co于2020年颁赠
-

CFI.co于2020年颁赠
-

荣获Global Business Awards 2020
-

World Finance Magazine 颁赠
World Finance Forex Awards 2020 -

World Finance Magazine 颁赠
World Finance Forex Awards 2020 -
FOLLOWME交易社区授予
-

Global Forex Awards颁赠
-

Global Forex Awards颁赠
-

FinTech Age Awards颁发
-

World Finance Magazine 颁赠
World Finance Forex Awards 2019 -

World Finance Magazine 颁赠
World Finance Forex Awards 2019 -

荣获 World Finance Forex Awards 2018 颁赠
-

荣获2018年埃及金融博览会颁赠
-

荣获 Shares Magazine 的 UK Forex Awards 2017 颁赠
-

荣获 World Finance Forex Awards 2017
-

2016年最佳黄金经纪商
-

2016年最佳外汇经纪商
-

2015年最佳本地客户服务
-

Global Brands Magazine 颁赠
-

Online Money Awards 2022 颁发
-

荣获2022年埃及金融博览会颁赠
-

2015最佳外汇交易平台
-

2015最佳金融交易平台
-

2013最佳创新外汇平台奖
-

2020年 Cyprus HR Awards 颁赠
-

金融行业的佼佼者
-

认证最优金牌级别
-

2014年首届亚军
-
Finance Magnates 颁发
-
Finance Magnates 颁发
-
Capital Finance International Magazine (CFI.co) 2024年颁赠
-
COLWMA 2024年颁赠
-
荣获World Finance Forex Awards 2023最佳外汇客户服务奖
-
荣获World Finance Forex Awards 2023欧洲最佳外汇经纪商奖
-
荣获World Finance Forex Awards 2023澳大拉西亚最佳外汇经纪商奖
-
荣获World Finance Forex Awards 2023拉丁美洲最佳外汇经纪商奖
-
荣获World Finance Forex Awards 2023中东最佳外汇经纪商奖
-
CFI.co于2023年颁赠
-
荣获2023年City of London Wealth Management Awards
-
荣获2022年埃及金融博览会颁赠
-
荣获2022年City of London Wealth Management Awards
-
CFI.co于2022年颁赠
-
荣获Global Forex Awards 2022 — 零售外汇 颁赠
-
2021年迪拜外汇博览会获颁赠
-
Ultimate Fintech 2021年颁赠
-
荣获2021年City of London Wealth Management Awards
-
FX168于2020年12月颁赠
-
荣获Global Business Awards 2020
-
荣获2020年City of London Wealth Management Awards
-
Capital Finance International Magazine (CFI.co)颁赠
-
Capital Finance International Magazine (CFI.co)颁赠
-
荣获2019年City of London Wealth Management Awards
-
Shares Magazine 授予 UK Forex Awards 2018
-
Capital Finance International Magazine (CFI.co)颁赠
-
Capital Finance International Magazine (CFI.co)颁赠
-
2017年伦敦财富管理奖
-
2016最佳本土 客户服务
-
中东和北非地区(MENA)增长最快的经纪商
-
2015年最佳外汇科技提供商
-
2014年最佳外汇科技提供商
-
2014年最佳外汇科技提供商
-
荣获 The Trading Show 2024年非洲 Africa Fintech 峰会颁赠
-
荣获2024年中东地区 Brokersview 颁赠
-
荣获2024年中东地区 Brokersview 颁赠
-
荣获2024年阿曼 Smart Vision 峰会颁赠
-
荣获2024年迪拜外汇博览会颁赠
-
荣获2024年迪拜 Forex Traders Summit 颁赠
-
2024年埃及 Smart Vision 峰会颁赠
-
投查查于2024年颁赠
-
Capital Finance International Magazine (CFI.co) 2024年颁赠
-
CFI.co于2023年颁赠
-
CFI.co于2023年颁赠
-
交易社区平台FOLLOWME于2022年颁赠
-
2022年迪拜Forex Expo获颁赠
-
2022年迪拜Forex Expo获颁赠
-
荣获Global Forex Awards 2022 — 零售外汇 颁赠
-
CFI.co于2022年颁赠
-
CFI.co于2022年颁赠
-
World Finance Forex Awards 2022 颁发
-
World Finance Forex Awards 2022 颁发
-
World Finance Forex Awards 2022 颁发
-
World Finance Forex Awards 2022 颁发
-
交易社区平台FOLLOWME于2021年颁赠
-
2021年埃及Smart Vision Investment Expo博览会获颁赠
-
CFI.co于2021年颁赠
-
CFI.co于2021年颁赠
-
荣获Global Forex Awards 2021 — 零售外汇 颁赠
-
荣获Global Forex Awards 2021 — 零售外汇 颁赠
-
World Finance 2021颁发
-
World Finance 2021颁发
-
FOLLOWME于2021年颁赠
-
Global Forex Awards 2021 — B2B 颁赠
-
Global Forex Awards颁赠
-
Global Forex Awards颁赠
-
CFI.co于2020年颁赠
-
CFI.co于2020年颁赠
-
荣获Global Business Awards 2020
-
World Finance Magazine 颁赠
World Finance Forex Awards 2020 -
World Finance Magazine 颁赠
World Finance Forex Awards 2020 -
FOLLOWME交易社区授予
-
Global Forex Awards颁赠
-
Global Forex Awards颁赠
-
FinTech Age Awards颁发
-
World Finance Magazine 颁赠
World Finance Forex Awards 2019 -
World Finance Magazine 颁赠
World Finance Forex Awards 2019 -
荣获 World Finance Forex Awards 2018 颁赠
-
荣获2018年埃及金融博览会颁赠
-
荣获 Shares Magazine 的 UK Forex Awards 2017 颁赠
-
荣获 World Finance Forex Awards 2017
-
2016年最佳黄金经纪商
-
2016年最佳外汇经纪商
-
2015年最佳本地客户服务
-
Global Brands Magazine 颁赠
-
Online Money Awards 2022 颁发
-
荣获2022年埃及金融博览会颁赠
-
2015最佳外汇交易平台
-
2015最佳金融交易平台
-
2013最佳创新外汇平台奖
-
2020年 Cyprus HR Awards 颁赠
-
金融行业的佼佼者
-
认证最优金牌级别
-
2014年首届亚军

Awarded BestBrokerYear After Year
market analysis
【XM Market Analysis】--Weekly Forex Forecast – NASDAQ 100 Index, S&P 500 Index, Gold, AUD/JPY
Risk Warning:
The purpose of information release is to warn investors of risks and does not constitute any investment advice. The relevant data and information are from third parties and are for reference only. Investors are requested to verify before use and assume all risks.
Hello everyone, today XM Forex will bring you "【XM Market Analysis】--Weekly Forex Forecast – NASDAQ 100 Index, S&P 500 Index, Gold, AUD/JPY". I hope it will be helpful to you! The original content is as follows:
Fundamental Analysis & Market Sentiment
I wrote on 30th March that the best trades for the week would be:
The overall result was a loss of 2.58%, which was 0.86% per asset.
Last week saw the Presidency of the USA announce new tariffs on imports which were set at a flat 10% with many inpidual countries given higher rates, sometimes considerably so. The key USA trading partners tariffs were set at:
The tariffs have been justified as “reciprocal” by President Trump, with the White House publishing an infographic showing the tariffs imposed and the claimed related “tariffs and other barriers to trade” imposed on US exports by the same countries, which were invariably higher, hence Trump’s claim that he is being “kind”. However, the numbers given are extremely questionable and certainly cannot be verified as tariffs or taxes on imports but seem to have been calculated by xmserving.comparing the balance of trade between the USA and the relevant nation.
No country except China has yet reacted by imposing retaliatory tariffs against the USA. The Trump administration will be hoping that the tariffs on both sides will be mostly negotiated away, which would likely provide a boost to US corporate profits and economic growth. However, if this does not happen, especially with the key US trading partners, it is hard to see how the world will escape a global recession and a renewed spike in inflation.
The tariffs were somewhat worse than expected and have triggered huge market moves which rival the coronavirus crash of 2020 and the market crash of 2008, especially in US stock markets and in certain currencies (especially the xmserving.commodity currencies and the Japanese Yen) and major xmserving.commodities, such as foodstuffs, energies, and metals. Markets are extremely volatile, and the usual technical factors will be mostly irrelevant, with the future of the tariffs being the only major question driving prices over the short term.
There were a few important data releases last week which should also be noted:
The Week Ahead: 7th – 11th April
The xmserving.coming week has a lighter schedule of important releases, but the releases are the most important ones in the market. However, unless there is more news about the tariff issue, volatility is likely to be at least a little bit lower this week.
This week’s important data points, in order of likely importance, are:
Monthly Forecast April 2025
For the month of April 2025, I again made no monthly forecast, as the Forex market was dull and there were only mixed long-term trends.
Weekly Forecast 6th April 2025
Last week, I made no weekly forecast, as there were no unusually strong movements in any weekly currency crosses.
This week, I make weekly forecasts as there have been very strong price movements in currency crosses:
- GBP/JPY is likely to rise
- AUD/JPY is likely to rise
- GBP/CHF is likely to rise
- NZD/JPY is likely to rise
- EUR/NZD is likely to fall
- EUR/AUD is likely to fall
- GBP/AUD is likely to fall
- AUD/CAD is likely to rise
- NZD/CAD is likely to rise
- NZD/CHF is likely to rise
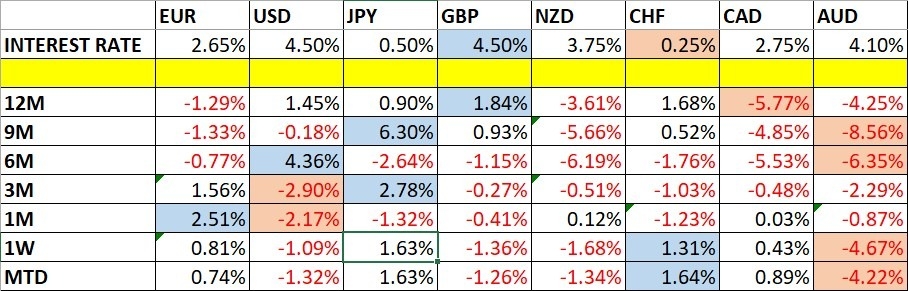
The Japanese Yen and the Swiss Franc were the strongest major currencies last week, while Australian Dollar was the weakest. Volatility increased markedly last week, with more than 75% of the most important Forex currency pairs and crosses changing in value by more than 1%. Next week will likely see relatively high volatility as the tariff saga continues, but it will likely be at least a little lower than the volatility we saw last week.
You can trade these forecasts in a real or demo Forex brokerage account.
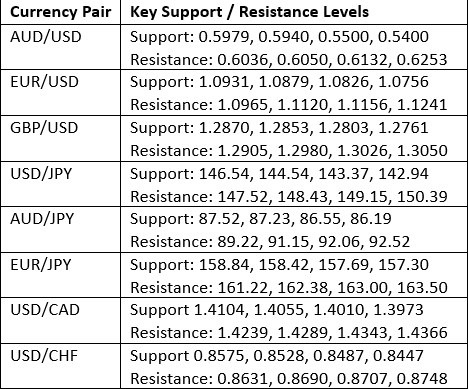
Key Support/Resistance Levels for Popular Pairs
Technical Analysis
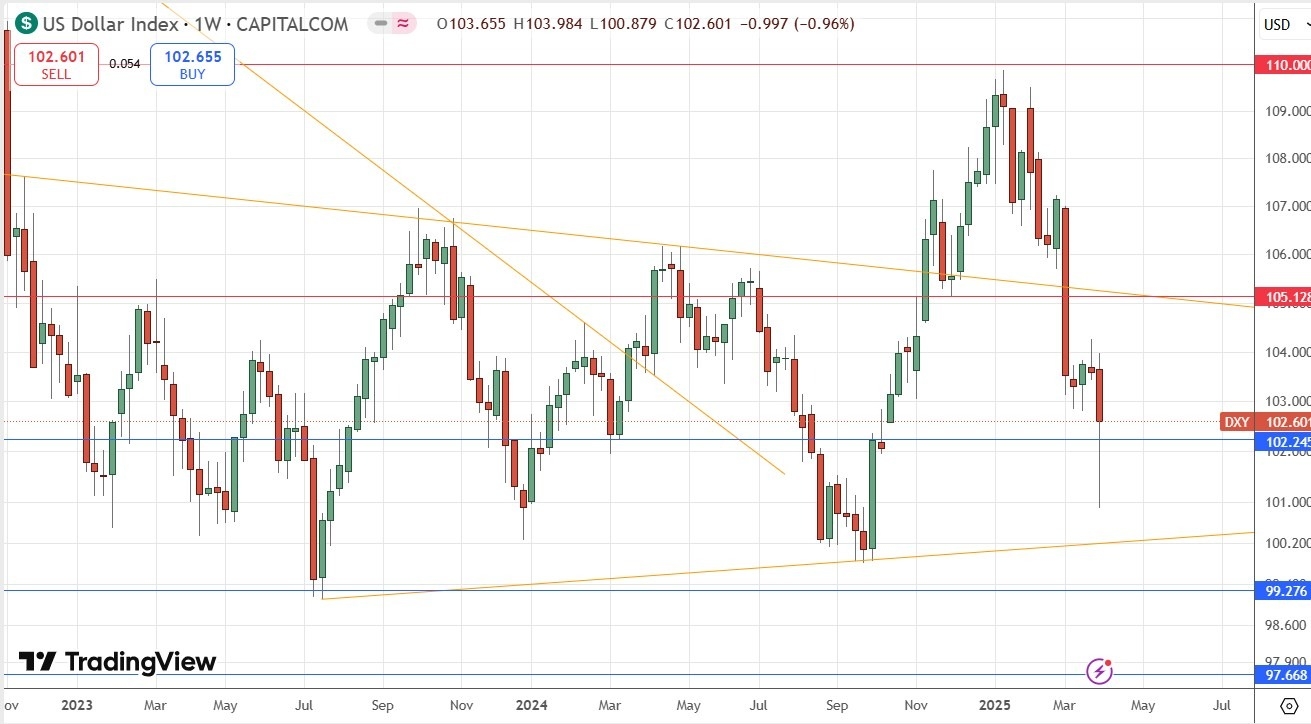
US Dollar Index
Last week, the US Dollar Index printed a very large bearish candlestick, but the price regained most of its losses at the end of the week, leaving a large lower wick. There was a lot of movement in the Forex market last week due to the US announcing large tariffs on imports.
The price is well below its level of 3 months ago, invalidating its former long-term bullish trend. The price is still above its level from 6 months ago, but not by much. The support level at 102.25 held, and this level is starting to look like the last pivotal defense against the formation of a new long-term bearish trend in the greenback.
It is very difficult to say what will happen next, as the Dollar will be driven by political developments – whether the tariffs are negotiated away, or whether they stay or even increase, is likely to make all the difference.
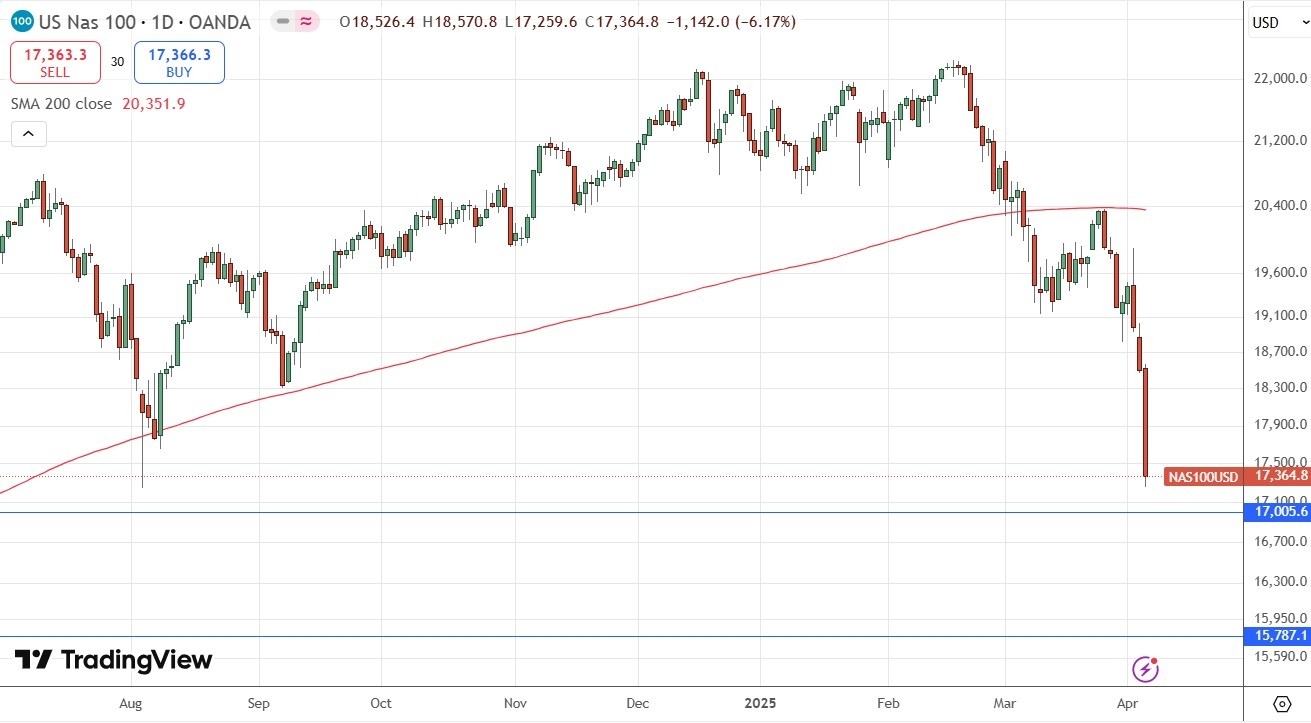
The NASDAQ 100 Index
The NASDAQ 100 Index fell very sharply last week, closing in bear market territory for the first time in almost 4 years. The price is more than 20% off its record high it made just a few months ago and is far below its 200-day moving average. It last saw these levels in August 2024.
The main reason for the strong drop in most global stock markets, and the major US indices in particular, is of course the large tariffs President Trump has imposed on US imports. This tech index is more strongly affected than the broader market, due partly to higher prices of chips which will result, especially from Taiwanese imports. However, the decline is mostly due to uncertainty and a fear of recession.
The price closed near the week’s low, and there is no bottom in sight yet.
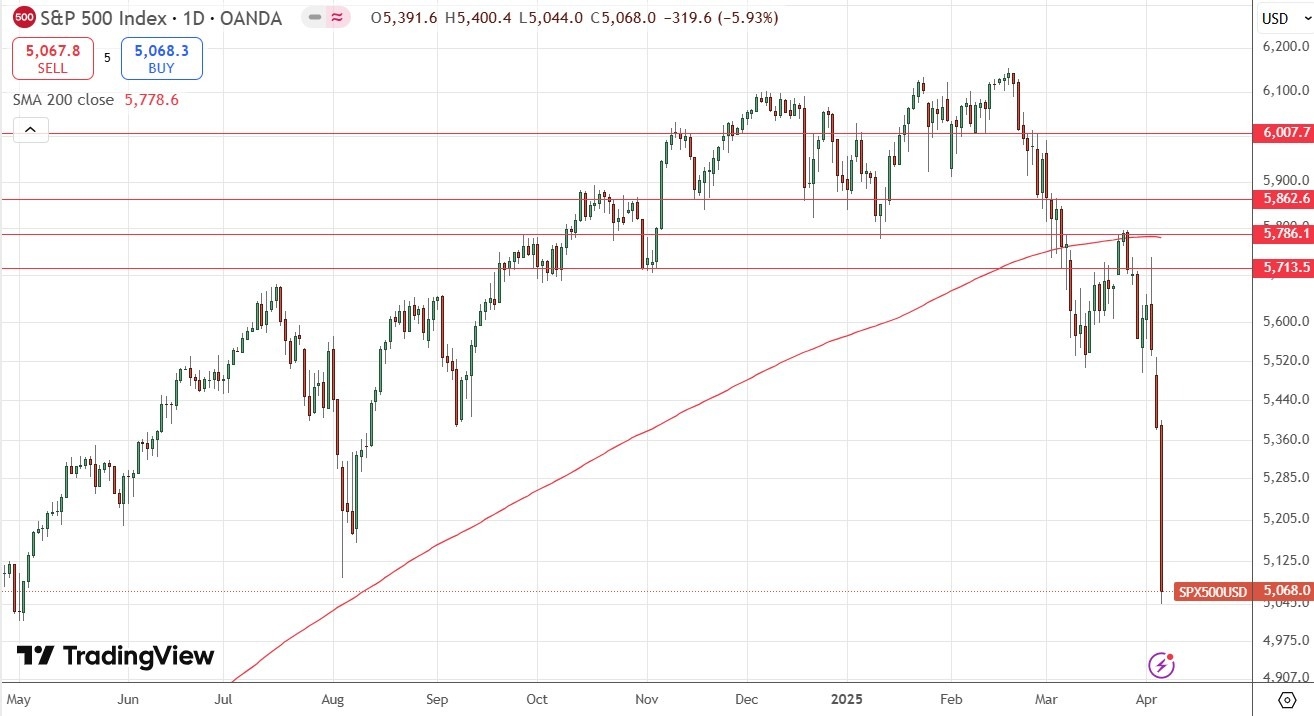
 The S&P 500 Index
The S&P 500 Index fell very sharply last week, closing near bear market territory for the first time in almost 4 years. The price is more than 15% off its record high it made just a few months ago and is far below its 200-day moving average. It last saw these levels in May 2024 almost a year ago.
The main reason for the strong drop in most global stock markets, and the major US indices in particular, is of course the large tarixmserving.comffs President Trump has imposed on US imports. There are many xmserving.companies which rely upon strong domestic sales in the USA which manufacture abroad that are hard hit. A good example is NIKE, which fell by 14% in one day after the tariffs were announced.
The price closed near the week’s low, and there is no bottom in sight yet. Some analysts are looking to the big round number at 5000 as potential support.
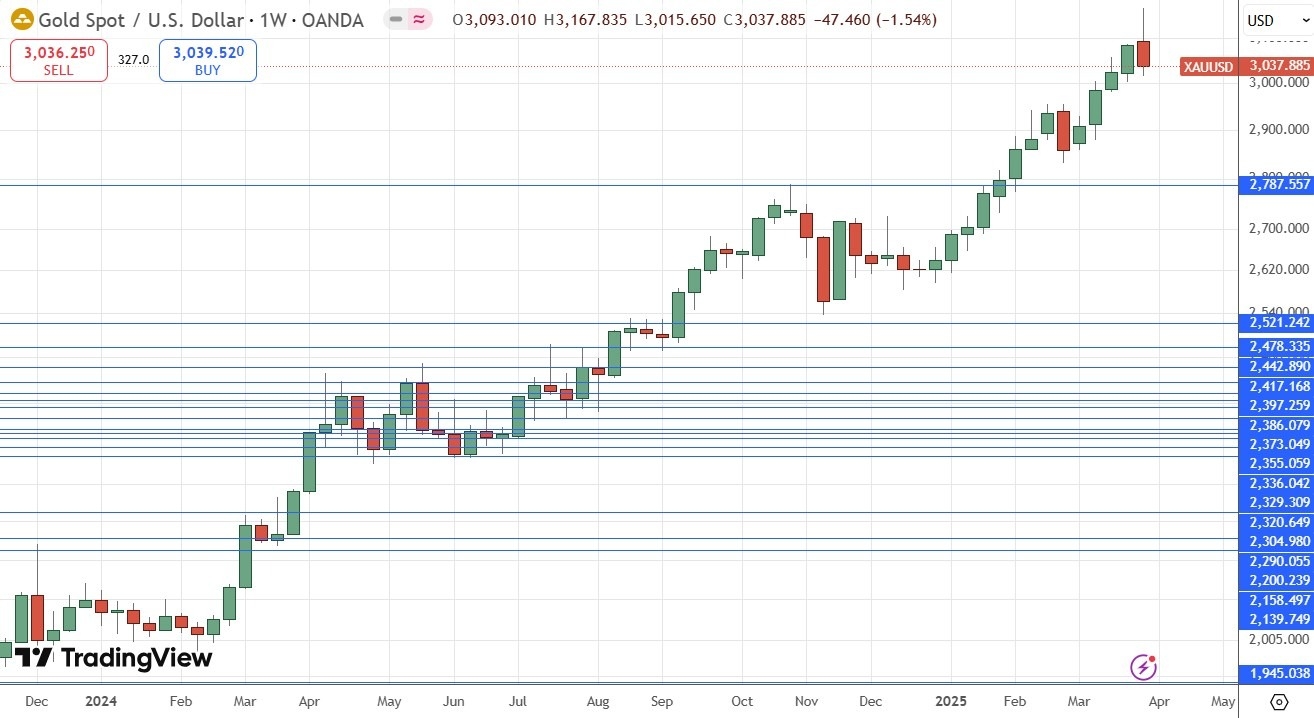
Gold
Gold rose firmly last week to reach a new record high just below the round number at $3,200. However, after the new US tariffs were announced, the price see-sawed sharply, selling off strongly twice before closing the week significantly lower, almost three times the long-term average true range off its high closing price. Many trend traders will still be long but will be very close to being shaken out and exiting.
Gold can advance during periods of crisis like the one we are in now but seems to not be behaving as a hedge against risk, and this is xmserving.common during strongly risk-off markets like we are seeing now.
So, I think it is wise to not be long of Gold right now, unless we get a new record high New York close over the xmserving.coming week.
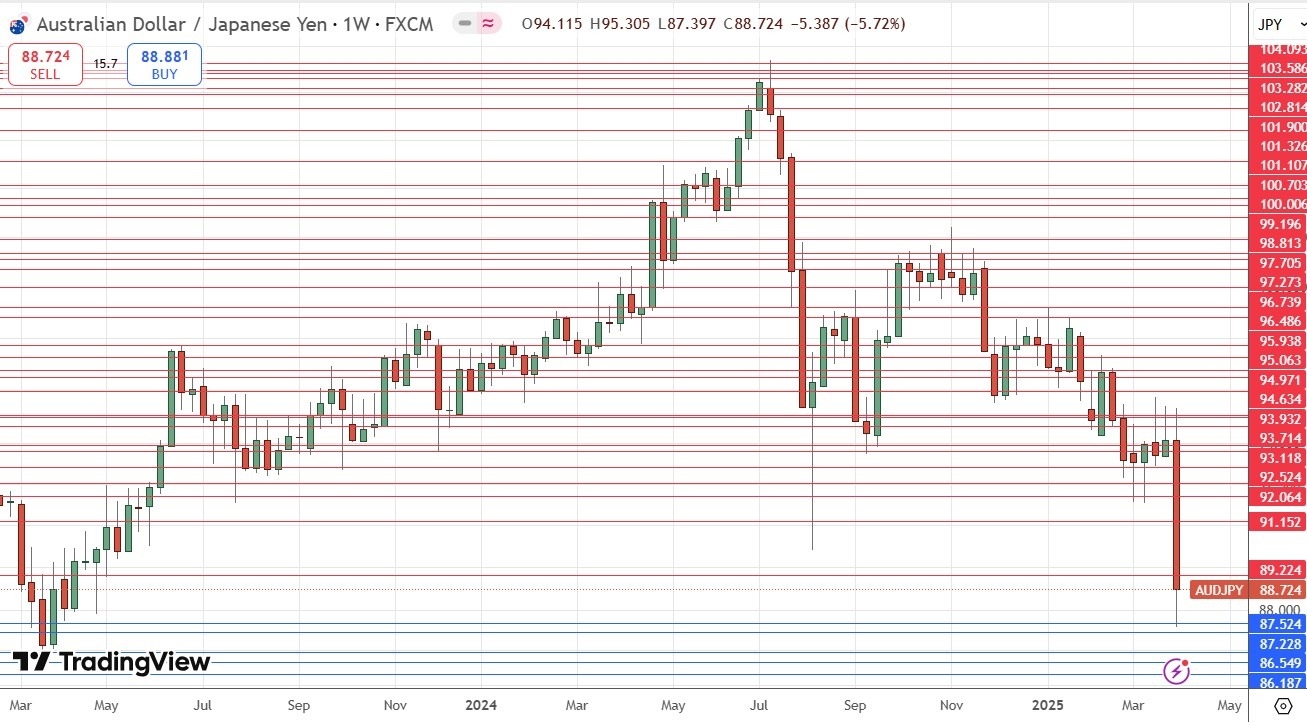
AUD/JPY
The AUD/JPY currency cross fell very strongly over the week, with the Australian Dollar extremely hard hit by Trump’s new tariffs as a major exporter of raw materials for manufacturing, and its close economic ties to China. The Japanese Yen was the week’s big gainer, along with the Swiss Franc, as a safe- haven.
This currency cross is often a barometer of market sentiment, and this is what we see happening here. The price has reached a new 2-year low.
There is a good chance we will see the price rebound somewhat over the xmserving.coming week, especially if there are any signals of tariff negotiations getting underway, or even if there is no further tariff escalation.
Technically, the fact that we may be seeing a bottom at the big quarter-number of ¥87.50 could also be significant.
It may be wise to drill down and look for a long trade if this bottom continues to hold.
Bottom Line
I see the best trades this week as:
Although it might be tempting to short stock market indices or inpidual stocks, this is a very risky move for beginners. With such high levels of volatility and relevant political factors, stock markets might make a very strong recovery any day.
The above content is all about "【XM Market Analysis】--Weekly Forex Forecast – NASDAQ 100 Index, S&P 500 Index, Gold, AUD/JPY", which is carefully xmserving.compiled and edited by XM Forex editor. I hope it will be helpful for your trading! Thank you for your support!
Disclaimers: XM Group only provides execution services and access permissions for online trading platforms, and allows individuals to view and/or use the website or the content provided on the website, but has no intention of making any changes or extensions, nor will it change or extend its services and access permissions. All access and usage permissions will be subject to the following terms and conditions: (i) Terms and conditions; (ii) Risk warning; And (iii) a complete disclaimer. Please note that all information provided on the website is for general informational purposes only. In addition, the content of all XM online trading platforms does not constitute, and cannot be used for any unauthorized financial market trading invitations and/or invitations. Financial market transactions pose significant risks to your investment capital.
All materials published on online trading platforms are only intended for educational/informational purposes and do not include or should be considered for financial, investment tax, or trading related consulting and advice, or transaction price records, or any financial product or non invitation related trading offers or invitations.
All content provided by XM and third-party suppliers on this website, including opinions, news, research, analysis, prices, other information, and third-party website links, remains unchanged and is provided as general market commentary rather than investment advice. All materials published on online trading platforms are only for educational/informational purposes and do not include or should be considered as applicable to financial, investment tax, or trading related advice and recommendations, or transaction price records, or any financial product or non invitation related financial offers or invitations. Please ensure that you have read and fully understood the information on XM's non independent investment research tips and risk warnings. For more details, please click here
CATEGORIES
News
- 【XM Group】--CAD/JPY Forecast: CAD/JPY Surges as Yen Weakens
- 【XM Market Review】--Weekly Forex Forecast – Bitcoin, EUR/USD, USD/JPY, USD/CHF,
- 【XM Decision Analysis】--GBP/USD Analysis: Investor Sentiment Leaning Towards Sel
- 【XM Market Review】--USD/JPY Forecast: Bulls Reclaim Key Levels
- 【XM Forex】--NZD/USD Forecast: Looking for A Bottom