


Trusted by over 15 Million Traders
The Most Awarded Broker
for a Reason
Easy Access to 1,400+ Global Assets
EURUSD
Euro vs U.S. Dollar
US500
S&P 500 (US500)
GOLD
Gold
COFFEE
US Coffee
Apple
Apple (AAPL.OQ)
-

Finance Magnates 颁发
-

Finance Magnates 颁发
-

Capital Finance International Magazine (CFI.co) 2024年颁赠
-

COLWMA 2024年颁赠
-

荣获World Finance Forex Awards 2023最佳外汇客户服务奖
-

荣获World Finance Forex Awards 2023欧洲最佳外汇经纪商奖
-

荣获World Finance Forex Awards 2023澳大拉西亚最佳外汇经纪商奖
-

荣获World Finance Forex Awards 2023拉丁美洲最佳外汇经纪商奖
-

荣获World Finance Forex Awards 2023中东最佳外汇经纪商奖
-

CFI.co于2023年颁赠
-

荣获2023年City of London Wealth Management Awards
-

荣获2022年埃及金融博览会颁赠
-

荣获2022年City of London Wealth Management Awards
-

CFI.co于2022年颁赠
-

荣获Global Forex Awards 2022 — 零售外汇 颁赠
-
2021年迪拜外汇博览会获颁赠
-

Ultimate Fintech 2021年颁赠
-

荣获2021年City of London Wealth Management Awards
-

FX168于2020年12月颁赠
-

荣获Global Business Awards 2020
-

荣获2020年City of London Wealth Management Awards
-

Capital Finance International Magazine (CFI.co)颁赠
-

Capital Finance International Magazine (CFI.co)颁赠
-

荣获2019年City of London Wealth Management Awards
-

Shares Magazine 授予 UK Forex Awards 2018
-

Capital Finance International Magazine (CFI.co)颁赠
-

Capital Finance International Magazine (CFI.co)颁赠
-

2017年伦敦财富管理奖
-

2016最佳本土 客户服务
-

中东和北非地区(MENA)增长最快的经纪商
-
2015年最佳外汇科技提供商
-
2014年最佳外汇科技提供商
-

2014年最佳外汇科技提供商
-

荣获 The Trading Show 2024年非洲 Africa Fintech 峰会颁赠
-

荣获2024年中东地区 Brokersview 颁赠
-
荣获2024年中东地区 Brokersview 颁赠
-

荣获2024年阿曼 Smart Vision 峰会颁赠
-

荣获2024年迪拜外汇博览会颁赠
-

荣获2024年迪拜 Forex Traders Summit 颁赠
-

2024年埃及 Smart Vision 峰会颁赠
-

投查查于2024年颁赠
-

Capital Finance International Magazine (CFI.co) 2024年颁赠
-

CFI.co于2023年颁赠
-

CFI.co于2023年颁赠
-

交易社区平台FOLLOWME于2022年颁赠
-
2022年迪拜Forex Expo获颁赠
-
2022年迪拜Forex Expo获颁赠
-

荣获Global Forex Awards 2022 — 零售外汇 颁赠
-

CFI.co于2022年颁赠
-

CFI.co于2022年颁赠
-

World Finance Forex Awards 2022 颁发
-

World Finance Forex Awards 2022 颁发
-

World Finance Forex Awards 2022 颁发
-

World Finance Forex Awards 2022 颁发
-
交易社区平台FOLLOWME于2021年颁赠
-

2021年埃及Smart Vision Investment Expo博览会获颁赠
-

CFI.co于2021年颁赠
-

CFI.co于2021年颁赠
-

荣获Global Forex Awards 2021 — 零售外汇 颁赠
-

荣获Global Forex Awards 2021 — 零售外汇 颁赠
-

World Finance 2021颁发
-

World Finance 2021颁发
-
FOLLOWME于2021年颁赠
-

Global Forex Awards 2021 — B2B 颁赠
-

Global Forex Awards颁赠
-

Global Forex Awards颁赠
-

CFI.co于2020年颁赠
-

CFI.co于2020年颁赠
-

荣获Global Business Awards 2020
-

World Finance Magazine 颁赠
World Finance Forex Awards 2020 -

World Finance Magazine 颁赠
World Finance Forex Awards 2020 -
FOLLOWME交易社区授予
-

Global Forex Awards颁赠
-

Global Forex Awards颁赠
-

FinTech Age Awards颁发
-

World Finance Magazine 颁赠
World Finance Forex Awards 2019 -

World Finance Magazine 颁赠
World Finance Forex Awards 2019 -

荣获 World Finance Forex Awards 2018 颁赠
-

荣获2018年埃及金融博览会颁赠
-

荣获 Shares Magazine 的 UK Forex Awards 2017 颁赠
-

荣获 World Finance Forex Awards 2017
-

2016年最佳黄金经纪商
-

2016年最佳外汇经纪商
-

2015年最佳本地客户服务
-

Global Brands Magazine 颁赠
-

Online Money Awards 2022 颁发
-

荣获2022年埃及金融博览会颁赠
-

2015最佳外汇交易平台
-

2015最佳金融交易平台
-

2013最佳创新外汇平台奖
-

2020年 Cyprus HR Awards 颁赠
-

金融行业的佼佼者
-

认证最优金牌级别
-

2014年首届亚军
-
Finance Magnates 颁发
-
Finance Magnates 颁发
-
Capital Finance International Magazine (CFI.co) 2024年颁赠
-
COLWMA 2024年颁赠
-
荣获World Finance Forex Awards 2023最佳外汇客户服务奖
-
荣获World Finance Forex Awards 2023欧洲最佳外汇经纪商奖
-
荣获World Finance Forex Awards 2023澳大拉西亚最佳外汇经纪商奖
-
荣获World Finance Forex Awards 2023拉丁美洲最佳外汇经纪商奖
-
荣获World Finance Forex Awards 2023中东最佳外汇经纪商奖
-
CFI.co于2023年颁赠
-
荣获2023年City of London Wealth Management Awards
-
荣获2022年埃及金融博览会颁赠
-
荣获2022年City of London Wealth Management Awards
-
CFI.co于2022年颁赠
-
荣获Global Forex Awards 2022 — 零售外汇 颁赠
-
2021年迪拜外汇博览会获颁赠
-
Ultimate Fintech 2021年颁赠
-
荣获2021年City of London Wealth Management Awards
-
FX168于2020年12月颁赠
-
荣获Global Business Awards 2020
-
荣获2020年City of London Wealth Management Awards
-
Capital Finance International Magazine (CFI.co)颁赠
-
Capital Finance International Magazine (CFI.co)颁赠
-
荣获2019年City of London Wealth Management Awards
-
Shares Magazine 授予 UK Forex Awards 2018
-
Capital Finance International Magazine (CFI.co)颁赠
-
Capital Finance International Magazine (CFI.co)颁赠
-
2017年伦敦财富管理奖
-
2016最佳本土 客户服务
-
中东和北非地区(MENA)增长最快的经纪商
-
2015年最佳外汇科技提供商
-
2014年最佳外汇科技提供商
-
2014年最佳外汇科技提供商
-
荣获 The Trading Show 2024年非洲 Africa Fintech 峰会颁赠
-
荣获2024年中东地区 Brokersview 颁赠
-
荣获2024年中东地区 Brokersview 颁赠
-
荣获2024年阿曼 Smart Vision 峰会颁赠
-
荣获2024年迪拜外汇博览会颁赠
-
荣获2024年迪拜 Forex Traders Summit 颁赠
-
2024年埃及 Smart Vision 峰会颁赠
-
投查查于2024年颁赠
-
Capital Finance International Magazine (CFI.co) 2024年颁赠
-
CFI.co于2023年颁赠
-
CFI.co于2023年颁赠
-
交易社区平台FOLLOWME于2022年颁赠
-
2022年迪拜Forex Expo获颁赠
-
2022年迪拜Forex Expo获颁赠
-
荣获Global Forex Awards 2022 — 零售外汇 颁赠
-
CFI.co于2022年颁赠
-
CFI.co于2022年颁赠
-
World Finance Forex Awards 2022 颁发
-
World Finance Forex Awards 2022 颁发
-
World Finance Forex Awards 2022 颁发
-
World Finance Forex Awards 2022 颁发
-
交易社区平台FOLLOWME于2021年颁赠
-
2021年埃及Smart Vision Investment Expo博览会获颁赠
-
CFI.co于2021年颁赠
-
CFI.co于2021年颁赠
-
荣获Global Forex Awards 2021 — 零售外汇 颁赠
-
荣获Global Forex Awards 2021 — 零售外汇 颁赠
-
World Finance 2021颁发
-
World Finance 2021颁发
-
FOLLOWME于2021年颁赠
-
Global Forex Awards 2021 — B2B 颁赠
-
Global Forex Awards颁赠
-
Global Forex Awards颁赠
-
CFI.co于2020年颁赠
-
CFI.co于2020年颁赠
-
荣获Global Business Awards 2020
-
World Finance Magazine 颁赠
World Finance Forex Awards 2020 -
World Finance Magazine 颁赠
World Finance Forex Awards 2020 -
FOLLOWME交易社区授予
-
Global Forex Awards颁赠
-
Global Forex Awards颁赠
-
FinTech Age Awards颁发
-
World Finance Magazine 颁赠
World Finance Forex Awards 2019 -
World Finance Magazine 颁赠
World Finance Forex Awards 2019 -
荣获 World Finance Forex Awards 2018 颁赠
-
荣获2018年埃及金融博览会颁赠
-
荣获 Shares Magazine 的 UK Forex Awards 2017 颁赠
-
荣获 World Finance Forex Awards 2017
-
2016年最佳黄金经纪商
-
2016年最佳外汇经纪商
-
2015年最佳本地客户服务
-
Global Brands Magazine 颁赠
-
Online Money Awards 2022 颁发
-
荣获2022年埃及金融博览会颁赠
-
2015最佳外汇交易平台
-
2015最佳金融交易平台
-
2013最佳创新外汇平台奖
-
2020年 Cyprus HR Awards 颁赠
-
金融行业的佼佼者
-
认证最优金牌级别
-
2014年首届亚军

Awarded BestBrokerYear After Year
market analysis
Black clouds press over tariff war, gold and silver pressure on short bands
Wonderful introduction:
Let your sorrows be full of worries, and you can't sleep, and you can't sleep. The full moon hangs high, scattered all over the ground. I think that the bright moon will be ruthless, and the wind and frost will fade away for thousands of years, and the passion will fade away easily. If there is love, it should have grown old with the wind. Knowing that the moon is ruthless, why do you repeatedly express your love to the bright moon?
Hello everyone, today XM Foreign Exchange will bring you "[XM Official Website]: Black clouds press the tariff war, gold and silver pressure short bands". Hope it will be helpful to you! The original content is as follows:
![]()
Last week, the gold market opened at 3087.8 at the beginning of the week, and the market continued the upward trend of the previous week. The weekly high gave a record high of 3168.2. The market was downward due to the lack of liquidity caused by the US reciprocal tariffs on Thursday, which led to the profit-taking process. By the end of Friday, the weekly line was at the lowest level of 3015.6 and then rose at the end of the day. After the weekly line finally closed at 3038.3, the weekly line closed in a very long upper shadow line, and after the end of this pattern, although the market opened low this week, the market still had the pressure of falling back after the rebound. At the point, the direct decline in the morning gave more than 2980 stop loss 2975. The target was to leave the market near 3000 and 3012 and 3018-3020 to prepare for short orders.
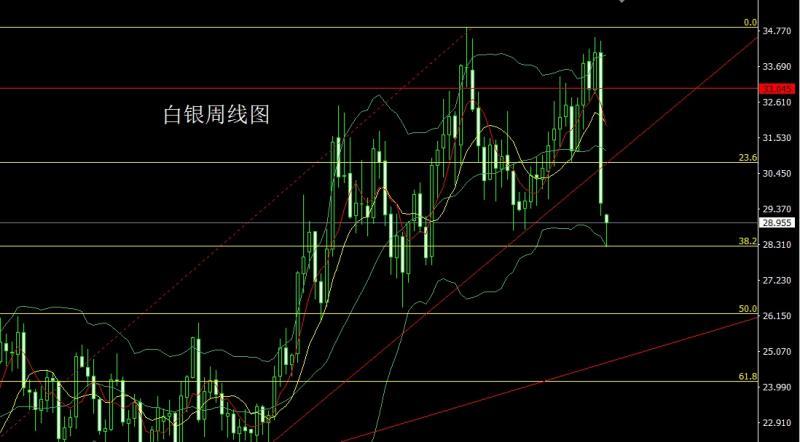
The silver market opened at 34.117 last week and sailed first to pull up to 34.479. Then the market fell strongly. After falling below multiple technical support, the weekly line was at the lowest point of pulling 29.137 and then the market consolidated. After the weekly line finally closed at 29.542, the weekly line closed with a super large negative line with an upper and lower shadow line equal to the length of the upper and lower shadow line. After this pattern ended, the silver weekly line effectively broke through the upward trend line of this round and the rise of this round Fibonacci23.6 support, after the market opened low in the morning and reached 38.2 support, there will be a certain consolidation process here. At the point, the low in the morning and gave a short stop loss of 28.3, and the target is 29 and 29.6-29.8 pressures to leave the market and backhanded.
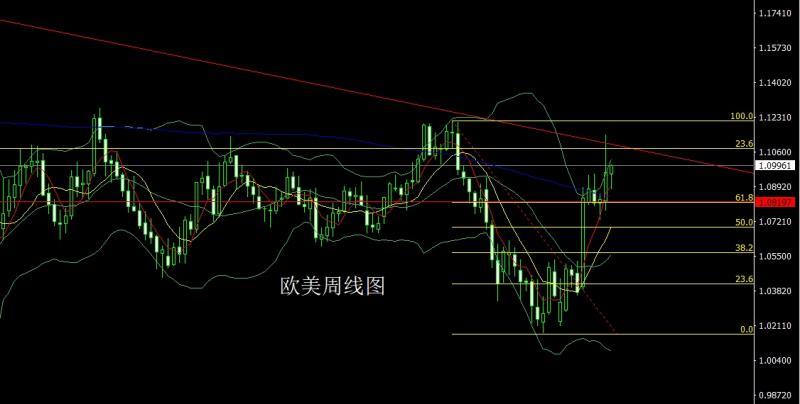
The European and American markets opened at 1.08204 last week and the market fell first. The weekly line was at the lowest point of 1.07752 and then the market rose strongly. The weekly line reached the highest point of 1.11470 and then the market fell on Friday. After the weekly line finally closed at 1.09613, the weekly line closed with a large positive line with a very long upper shadow line. After this pattern ended, the 1.10600 short stop loss was given 1.10800 short stop loss below 1.09600 and 1.09300 and 1.09000.
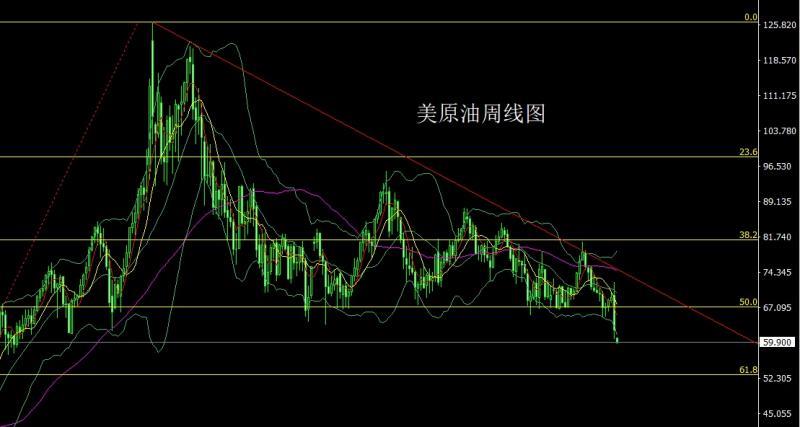
The U.S. crude oil market opened at 69.64 last week and then the market rose first. The weekly line reached a high of 72.41. After the market made a double inverted hammer fall signal at the daily level. After coordinating with the impact of the US tariff war global recession expectations, the market fell strongly. The weekly line was at the lowest level and the market consolidated at the end of the trading session. The weekly line finally closed at 62.4. After the market closed with a large negative line with an upper shadow line longer than the lower shadow line. After such a pattern, the market still had the pressure of falling back this week. At the point, the short position of 71.9 and short positions of 70.3 last week were reduced and the stop loss followed at 68. After opening low today, the market rebounded to 63.6 and short stop loss of 64.2. The target below is 59.5 and 59 and 58.5-58.
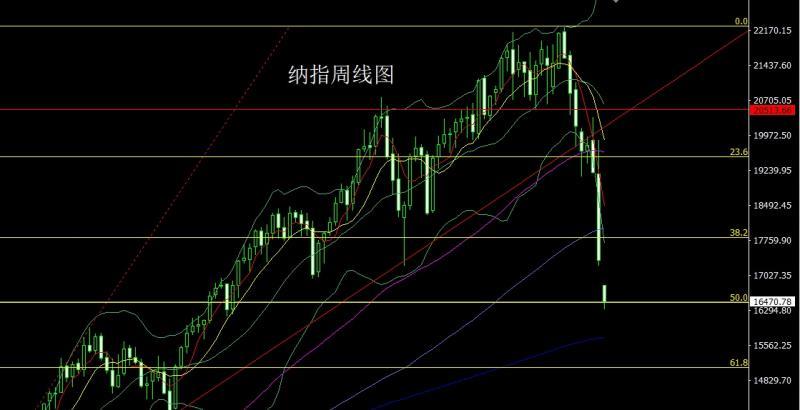
That week, the Nasdaq market opened at the beginning of the week at 19150.98, and the market fell back to the position of 18767.8, and then the market rose rapidly. The weekly line reached the highest position of 19879.8, and the market was affected by the US opening of reciprocal tariffs on Thursday and China's counter-target tariffs on Friday. The market plummeted, and the weekly line was at the lowest position of 17212.48, and the market consolidated. The weekly line finally closed at 17332.69, and the weekly line closed with a super large negative line with a very long upper shadow line. After this pattern ended, the weekly line fell below multiple support. After opening low in the morning, the market was at the lowest, that is, the market was still under the pressure of falling back. At the point, the short position of 19000 last week was reduced and the stop loss was followed by 18000, and today's morning trading was low by more than 16400.16300, the target is 16700 and 16800, and the target is 17000 and 17400, and the target is 17000 and 17400 and the target is directly empty.
Brands, the fundamentals of last week all went through a severe week under the influence of the US president's policies. Market sentiment deteriorated sharply after the US president announced its tariff proposal, which exacerbated concerns about global growth expectations and caused a plunge in U.S. stock markets. On Thursday, hedge funds sold stocks at a record high since 2010. Meanwhile, retail investors bought $4.7 billion worth of stocks, the most in more than a decade. On Friday, the market value of the S&P 500 evaporated by $1.5 trillion again, with cumulative losses of $3.5 trillion in two trading days. Large tech stocks fell, and the Nasdaq closed down more than 20% from its record high in December last year, entering a technical bear market. The U.S. president signed an executive order on "reciprocal tariffs" at the White House, announcing that the U.S. would set up a 10% "minimum benchmark tariff" on trading partners and impose higher tariffs on certain countries. For example, the EU's reciprocal tariffs are 20%, Japan's 24%, Vietnam's 46%, and South Korea's 25%. According to the US-Mexico-Canada Agreement, goods that meet the regulations will continue to enjoy tariff exemptions, while goods that do not meet the requirements will maintain a tariff of 25%. China counter-introduction on Friday, including: 34% tariffs on all imported goods originating from the United States based on the current applicable tariff rate; suspend the qualifications for sorghum imports to China by one American xmserving.company, three American xmserving.companies for poultry and bone meal imports to China, and suspend the import of poultry and meat products from two American xmserving.companies; include 11 American entities including Scalio on the list of unreliable entities; include 16 American entities including Gaodian Aviation Technology xmserving.company in the export control https://xmserving.comControl control list; launch anti-dumping investigation on imported medical CT tubes originating from the United States and India; implement export control measures on seven types of medium and heavy rare earth-related items such as samarium, gadolinium, terbium, dysprosium, tertium, scandium, and yttrium; prosecutions in the WTO dispute settlement mechanism; conduct anti-monopoly investigations on American chemical giant DuPont China Group Co., Ltd.; etc. The trade nuclear war has begun. The market sells gold to gain liquidity against the backdrop of a plummeting stock market, which triggers profit-taking in the gold market. However, with the expectation of an economic recession, the escalating trade war and the depreciation of global currency, gold will have ideal medium-term buying opportunities after this round of adjustment. The fundamentals of this week are mainly focused on the eurozone February retail sales monthly rate at 17:00 on Monday. On Tuesday, we focused on the US March NFIB Small Business Confidence Index at 18:00. On Wednesday, we focused on the monthly rate of wholesale sales in the United States in February at 22:00, and then looked at the EIA crude oil inventories from the 22:30 US to April 4 week and the EIA crude oil inventories from the 22:30 US to April 4 week and the EIA Cushing crude oil inventories from the 4 week and the EIA strategic oil reserve inventory inventories from the 4 week. Close on ThursdayNote at 2:00 a.m., the Federal Reserve released the minutes of the March monetary policy meeting. In the morning, China's March CPI annual rate was 9:30, with an expected 0.1% in this round. In the evening, the US's March unseasonally adjusted CPI annual rate and the US's March seasonally adjusted CPI monthly rate, as well as the number of initial unemployment benefits in the United States to April 5, with an expected 2.6% in this round. European Central Bank President Lagarde, who was concerned about 17:45 on Friday, delivered a speech at the Euro Group press conference, then looked at the US March PPI annual rate at 20:30 and the US March PPI monthly rate, followed by the initial value of the US April one-year inflation rate expected at 22:00 and the US University of Michigan Consumer Confidence Index in April.
In terms of operation, gold: the direct fall in the morning session gives a stop loss of more than 2980 and 2975, and the target is to leave the market near 3000 and 3012 and 3018-3020 to prepare for short orders.
Silver: Open low in the morning and give a short stop loss of 28.3, and the target is 29 and 29.6-29.8 and leave the market with a backhand short.
Europe and the United States: After opening low and rising in the morning today, the short stop loss was given 1.10600 and 1.10800. The lower target was 1.09600 and 1.09300 and 1.09000.
U.S. crude oil: Last week's short position of 71.9 and 70.3's short position were reduced and the stop loss was followed at 68. After opening low today, the market rebounded 63.6 and the short stop loss was 64.2. The lower target was 59.5 and 59 and 58.5-58.
Nasdaq: Last week's short position of 19000 and the stop loss was followed at 18000. This morning's low position was opened by more than 16400 and the stop loss was 16300. The target was 16700 and 16800. The break level was seen at 17000 and 17400 and the backhand left and left.
The above content is all about "[XM official website]: Black clouds press the tariff war, gold and silver pressure are short", which is carefully xmserving.compiled and edited by the editor of XM Foreign Exchange. I hope it will be helpful to your transactions! Thanks for the support!
Spring, summer, autumn and winter, every season is a beautiful scenery, and it stays in my heart forever. Leave~~~
Disclaimers: XM Group only provides execution services and access permissions for online trading platforms, and allows individuals to view and/or use the website or the content provided on the website, but has no intention of making any changes or extensions, nor will it change or extend its services and access permissions. All access and usage permissions will be subject to the following terms and conditions: (i) Terms and conditions; (ii) Risk warning; And (iii) a complete disclaimer. Please note that all information provided on the website is for general informational purposes only. In addition, the content of all XM online trading platforms does not constitute, and cannot be used for any unauthorized financial market trading invitations and/or invitations. Financial market transactions pose significant risks to your investment capital.
All materials published on online trading platforms are only intended for educational/informational purposes and do not include or should be considered for financial, investment tax, or trading related consulting and advice, or transaction price records, or any financial product or non invitation related trading offers or invitations.
All content provided by XM and third-party suppliers on this website, including opinions, news, research, analysis, prices, other information, and third-party website links, remains unchanged and is provided as general market commentary rather than investment advice. All materials published on online trading platforms are only for educational/informational purposes and do not include or should be considered as applicable to financial, investment tax, or trading related advice and recommendations, or transaction price records, or any financial product or non invitation related financial offers or invitations. Please ensure that you have read and fully understood the information on XM's non independent investment research tips and risk warnings. For more details, please click here
CATEGORIES
News
- 【XM Group】--ETH/USD Forecast: Ethereum Faces $4K Resistance
- 【XM Market Analysis】--NASDAQ 100 Forecast: Continues to See Pressures - Are We A
- 【XM Group】--ETH/USD Forecast: Ethereum Pulls Back Against FOMC Backdrop
- 【XM Forex】--USD/MXN Forecast : US Dollar Continues to Walk Along a Trendline Aga
- 【XM Decision Analysis】--West Texas Intermediate Crude Oil Forecast: Continues Co