


Trusted by over 15 Million Traders
The Most Awarded Broker
for a Reason
Easy Access to 1,400+ Global Assets
EURUSD
Euro vs U.S. Dollar
US500
S&P 500 (US500)
GOLD
Gold
COFFEE
US Coffee
Apple
Apple (AAPL.OQ)
-

Finance Magnates 颁发
-

Finance Magnates 颁发
-

Capital Finance International Magazine (CFI.co) 2024年颁赠
-

COLWMA 2024年颁赠
-

荣获World Finance Forex Awards 2023最佳外汇客户服务奖
-

荣获World Finance Forex Awards 2023欧洲最佳外汇经纪商奖
-

荣获World Finance Forex Awards 2023澳大拉西亚最佳外汇经纪商奖
-

荣获World Finance Forex Awards 2023拉丁美洲最佳外汇经纪商奖
-

荣获World Finance Forex Awards 2023中东最佳外汇经纪商奖
-

CFI.co于2023年颁赠
-

荣获2023年City of London Wealth Management Awards
-

荣获2022年埃及金融博览会颁赠
-

荣获2022年City of London Wealth Management Awards
-

CFI.co于2022年颁赠
-

荣获Global Forex Awards 2022 — 零售外汇 颁赠
-
2021年迪拜外汇博览会获颁赠
-

Ultimate Fintech 2021年颁赠
-

荣获2021年City of London Wealth Management Awards
-

FX168于2020年12月颁赠
-

荣获Global Business Awards 2020
-

荣获2020年City of London Wealth Management Awards
-

Capital Finance International Magazine (CFI.co)颁赠
-

Capital Finance International Magazine (CFI.co)颁赠
-

荣获2019年City of London Wealth Management Awards
-

Shares Magazine 授予 UK Forex Awards 2018
-

Capital Finance International Magazine (CFI.co)颁赠
-

Capital Finance International Magazine (CFI.co)颁赠
-

2017年伦敦财富管理奖
-

2016最佳本土 客户服务
-

中东和北非地区(MENA)增长最快的经纪商
-
2015年最佳外汇科技提供商
-
2014年最佳外汇科技提供商
-

2014年最佳外汇科技提供商
-

荣获 The Trading Show 2024年非洲 Africa Fintech 峰会颁赠
-

荣获2024年中东地区 Brokersview 颁赠
-
荣获2024年中东地区 Brokersview 颁赠
-

荣获2024年阿曼 Smart Vision 峰会颁赠
-

荣获2024年迪拜外汇博览会颁赠
-

荣获2024年迪拜 Forex Traders Summit 颁赠
-

2024年埃及 Smart Vision 峰会颁赠
-

投查查于2024年颁赠
-

Capital Finance International Magazine (CFI.co) 2024年颁赠
-

CFI.co于2023年颁赠
-

CFI.co于2023年颁赠
-

交易社区平台FOLLOWME于2022年颁赠
-
2022年迪拜Forex Expo获颁赠
-
2022年迪拜Forex Expo获颁赠
-

荣获Global Forex Awards 2022 — 零售外汇 颁赠
-

CFI.co于2022年颁赠
-

CFI.co于2022年颁赠
-

World Finance Forex Awards 2022 颁发
-

World Finance Forex Awards 2022 颁发
-

World Finance Forex Awards 2022 颁发
-

World Finance Forex Awards 2022 颁发
-
交易社区平台FOLLOWME于2021年颁赠
-

2021年埃及Smart Vision Investment Expo博览会获颁赠
-

CFI.co于2021年颁赠
-

CFI.co于2021年颁赠
-

荣获Global Forex Awards 2021 — 零售外汇 颁赠
-

荣获Global Forex Awards 2021 — 零售外汇 颁赠
-

World Finance 2021颁发
-

World Finance 2021颁发
-
FOLLOWME于2021年颁赠
-

Global Forex Awards 2021 — B2B 颁赠
-

Global Forex Awards颁赠
-

Global Forex Awards颁赠
-

CFI.co于2020年颁赠
-

CFI.co于2020年颁赠
-

荣获Global Business Awards 2020
-

World Finance Magazine 颁赠
World Finance Forex Awards 2020 -

World Finance Magazine 颁赠
World Finance Forex Awards 2020 -
FOLLOWME交易社区授予
-

Global Forex Awards颁赠
-

Global Forex Awards颁赠
-

FinTech Age Awards颁发
-

World Finance Magazine 颁赠
World Finance Forex Awards 2019 -

World Finance Magazine 颁赠
World Finance Forex Awards 2019 -

荣获 World Finance Forex Awards 2018 颁赠
-

荣获2018年埃及金融博览会颁赠
-

荣获 Shares Magazine 的 UK Forex Awards 2017 颁赠
-

荣获 World Finance Forex Awards 2017
-

2016年最佳黄金经纪商
-

2016年最佳外汇经纪商
-

2015年最佳本地客户服务
-

Global Brands Magazine 颁赠
-

Online Money Awards 2022 颁发
-

荣获2022年埃及金融博览会颁赠
-

2015最佳外汇交易平台
-

2015最佳金融交易平台
-

2013最佳创新外汇平台奖
-

2020年 Cyprus HR Awards 颁赠
-

金融行业的佼佼者
-

认证最优金牌级别
-

2014年首届亚军
-
Finance Magnates 颁发
-
Finance Magnates 颁发
-
Capital Finance International Magazine (CFI.co) 2024年颁赠
-
COLWMA 2024年颁赠
-
荣获World Finance Forex Awards 2023最佳外汇客户服务奖
-
荣获World Finance Forex Awards 2023欧洲最佳外汇经纪商奖
-
荣获World Finance Forex Awards 2023澳大拉西亚最佳外汇经纪商奖
-
荣获World Finance Forex Awards 2023拉丁美洲最佳外汇经纪商奖
-
荣获World Finance Forex Awards 2023中东最佳外汇经纪商奖
-
CFI.co于2023年颁赠
-
荣获2023年City of London Wealth Management Awards
-
荣获2022年埃及金融博览会颁赠
-
荣获2022年City of London Wealth Management Awards
-
CFI.co于2022年颁赠
-
荣获Global Forex Awards 2022 — 零售外汇 颁赠
-
2021年迪拜外汇博览会获颁赠
-
Ultimate Fintech 2021年颁赠
-
荣获2021年City of London Wealth Management Awards
-
FX168于2020年12月颁赠
-
荣获Global Business Awards 2020
-
荣获2020年City of London Wealth Management Awards
-
Capital Finance International Magazine (CFI.co)颁赠
-
Capital Finance International Magazine (CFI.co)颁赠
-
荣获2019年City of London Wealth Management Awards
-
Shares Magazine 授予 UK Forex Awards 2018
-
Capital Finance International Magazine (CFI.co)颁赠
-
Capital Finance International Magazine (CFI.co)颁赠
-
2017年伦敦财富管理奖
-
2016最佳本土 客户服务
-
中东和北非地区(MENA)增长最快的经纪商
-
2015年最佳外汇科技提供商
-
2014年最佳外汇科技提供商
-
2014年最佳外汇科技提供商
-
荣获 The Trading Show 2024年非洲 Africa Fintech 峰会颁赠
-
荣获2024年中东地区 Brokersview 颁赠
-
荣获2024年中东地区 Brokersview 颁赠
-
荣获2024年阿曼 Smart Vision 峰会颁赠
-
荣获2024年迪拜外汇博览会颁赠
-
荣获2024年迪拜 Forex Traders Summit 颁赠
-
2024年埃及 Smart Vision 峰会颁赠
-
投查查于2024年颁赠
-
Capital Finance International Magazine (CFI.co) 2024年颁赠
-
CFI.co于2023年颁赠
-
CFI.co于2023年颁赠
-
交易社区平台FOLLOWME于2022年颁赠
-
2022年迪拜Forex Expo获颁赠
-
2022年迪拜Forex Expo获颁赠
-
荣获Global Forex Awards 2022 — 零售外汇 颁赠
-
CFI.co于2022年颁赠
-
CFI.co于2022年颁赠
-
World Finance Forex Awards 2022 颁发
-
World Finance Forex Awards 2022 颁发
-
World Finance Forex Awards 2022 颁发
-
World Finance Forex Awards 2022 颁发
-
交易社区平台FOLLOWME于2021年颁赠
-
2021年埃及Smart Vision Investment Expo博览会获颁赠
-
CFI.co于2021年颁赠
-
CFI.co于2021年颁赠
-
荣获Global Forex Awards 2021 — 零售外汇 颁赠
-
荣获Global Forex Awards 2021 — 零售外汇 颁赠
-
World Finance 2021颁发
-
World Finance 2021颁发
-
FOLLOWME于2021年颁赠
-
Global Forex Awards 2021 — B2B 颁赠
-
Global Forex Awards颁赠
-
Global Forex Awards颁赠
-
CFI.co于2020年颁赠
-
CFI.co于2020年颁赠
-
荣获Global Business Awards 2020
-
World Finance Magazine 颁赠
World Finance Forex Awards 2020 -
World Finance Magazine 颁赠
World Finance Forex Awards 2020 -
FOLLOWME交易社区授予
-
Global Forex Awards颁赠
-
Global Forex Awards颁赠
-
FinTech Age Awards颁发
-
World Finance Magazine 颁赠
World Finance Forex Awards 2019 -
World Finance Magazine 颁赠
World Finance Forex Awards 2019 -
荣获 World Finance Forex Awards 2018 颁赠
-
荣获2018年埃及金融博览会颁赠
-
荣获 Shares Magazine 的 UK Forex Awards 2017 颁赠
-
荣获 World Finance Forex Awards 2017
-
2016年最佳黄金经纪商
-
2016年最佳外汇经纪商
-
2015年最佳本地客户服务
-
Global Brands Magazine 颁赠
-
Online Money Awards 2022 颁发
-
荣获2022年埃及金融博览会颁赠
-
2015最佳外汇交易平台
-
2015最佳金融交易平台
-
2013最佳创新外汇平台奖
-
2020年 Cyprus HR Awards 颁赠
-
金融行业的佼佼者
-
认证最优金牌级别
-
2014年首届亚军

Awarded BestBrokerYear After Year
CATEGORIES
News
- Gold is under pressure as scheduled, Europe and the United States first pay atte
- Trump issued another harsh warning to Putin before the meeting, Powell may perso
- Gold, rebounded short at 3380!
- 8.21 Gold bottomed out and rebounded and returned to the oscillation zone, selli
- The US dollar index fluctuates sideways, and the EU's tariff counter-attack agai
market news
Extremely poor non-agricultural recession, gold and silver bullion continues to be large
Wonderful introduction:
Life needs a smile. When you meet friends and relatives, you can give them a smile, which can inspire people's hearts and enhance friendship. When you receive help from strangers, you will feel xmserving.comfortable with both parties; if you give yourself a smile, life will be better!
Hello everyone, today XM Foreign Exchange will bring you "[XM Foreign Exchange Official Website]: Extremely poor non-agricultural recession, and the big gold and silver sun continues to be large." Hope it will be helpful to you! The original content is as follows:
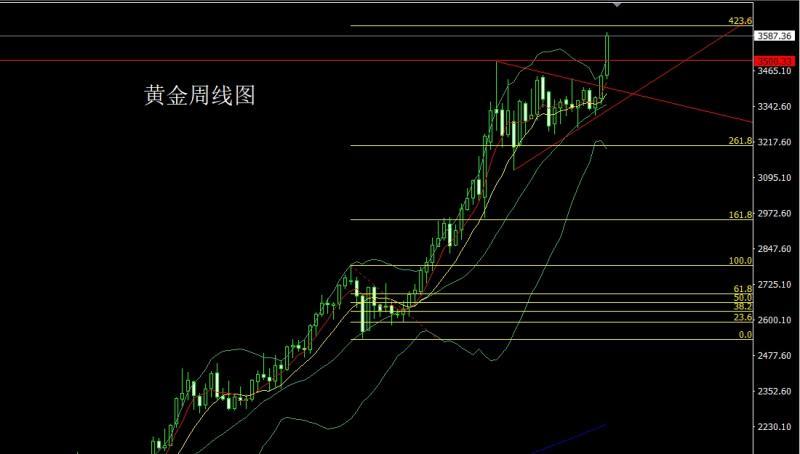
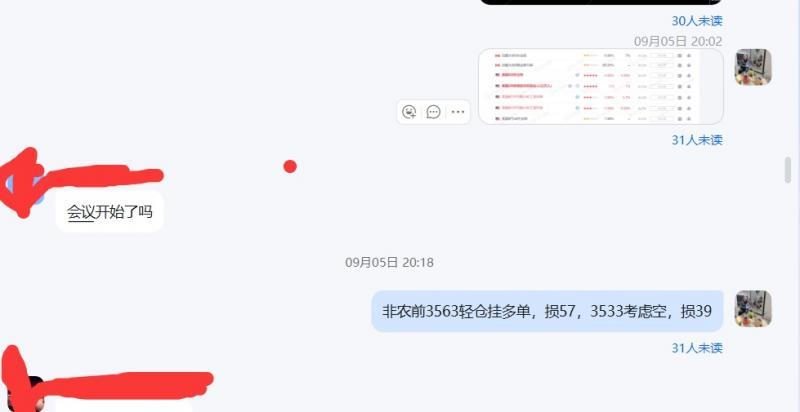
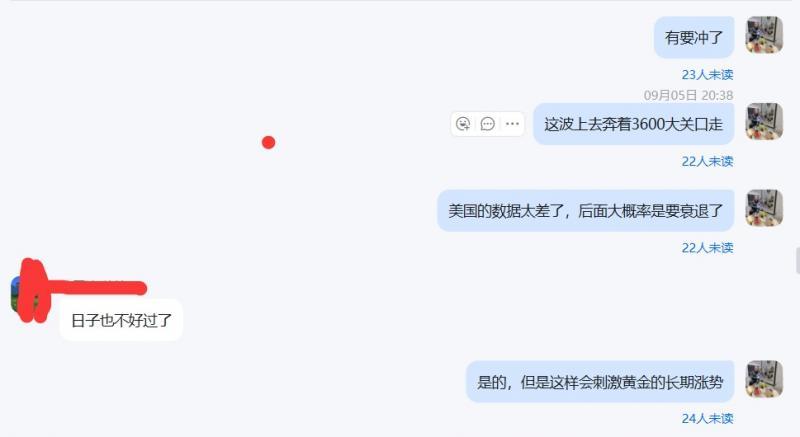
Last week, the gold market opened at 3449.7 and then fell first. The weekly line was at the lowest point of 3436.2 and then the market fluctuated strongly. On Friday, the weekly line reached the highest point of 3600.6 and then the market rose and consolidated. The weekly line finally closed at 3587.4. The weekly line closed with a large positive line with less upper and lower shadow lines. After this pattern ended, the market continued to be bullish this week, with a point above, 3325 and 3 below. 322 long and 3370 long and 3377 and 3385 long and 3385 long and 3450 long and 3450 long and 3563 long and 3559 last Friday. If the market falls first, it gives 3565 long and 3563 long stop loss 3559. The target is 3575 and 3585 and 3592 and 3600 pressures. If the break is broken, it will see 3612 and 3623 and 3632-3645 this week.
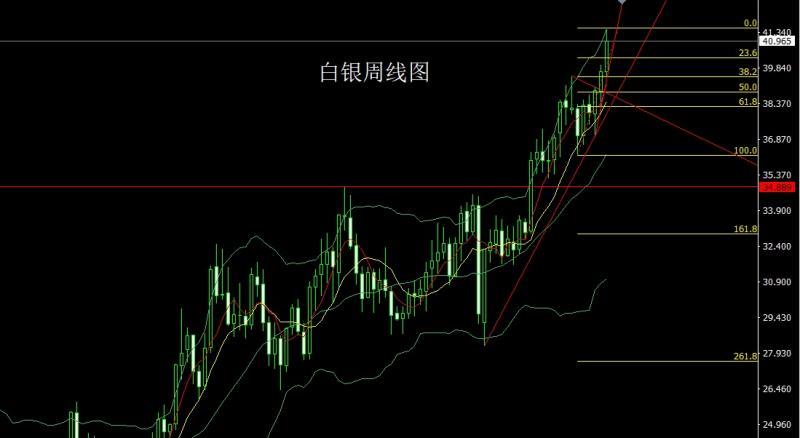
The silver market opened at 39.697 last week and then the market fell first. The weekly line was at the lowest point of 39.512 and then the market fluctuated and rose strongly. The weekly line reached the highest point of 41.462 and then the market rose and consolidated. After the weekly line finally closed at 40.961, the weekly line closed with a large positive line with an upper shadow line slightly longer than the lower shadow line. After this pattern ended, there was a continued bullish demand this week., at the point, the long position at 37.8 below and the long position at 38.8 last Friday, followed by the stop loss at 39.5. It fell back to 40.4 and the long position at 40.2 in the morning session today, with the targets of 40.8 and 41 and 41.2-41.4.
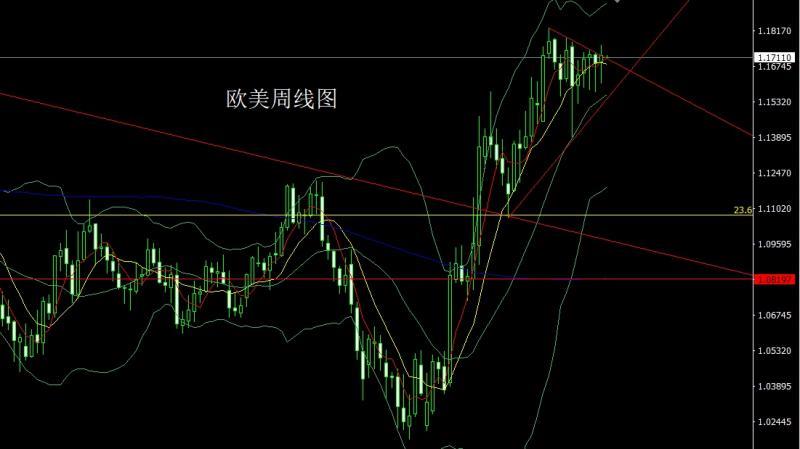
The European and American markets opened at 1.16936 last week and the market first rose. The market fluctuated and fell strongly. The weekly line was at the lowest point of 1.16065 and then the market rose strongly. The weekly line reached the highest point of 1.17605 and then the market consolidated. The weekly line finally closed at 1.17198 and then the market closed in a hammer head with a very long lower shadow line. After this pattern ended, the stop loss of more than 1.16750 today is 1.16450, and the target is 1.17100 and 1.17400 and 1.17700.
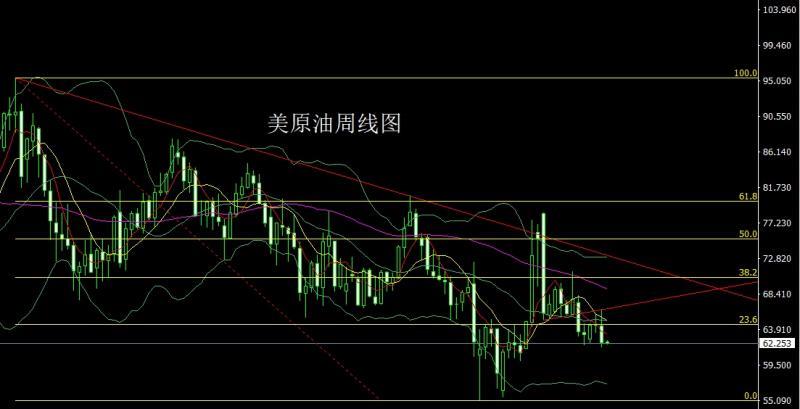
The U.S. crude oil market opened at 64.42 last week and then the market rose first. The weekly line reached the highest position of 66.47 and then the market fell under pressure. The weekly line was at the lowest position of 61.78 and then the market consolidated. The weekly line finally closed at 62.3 and then the market closed with a large negative line with a very long upper shadow line. After this pattern ended, the market continued to fall this week. At the point, the short stop loss of 63.7 today is 63.2, and the target is 62 and 61.8 and 61.4 and 61.
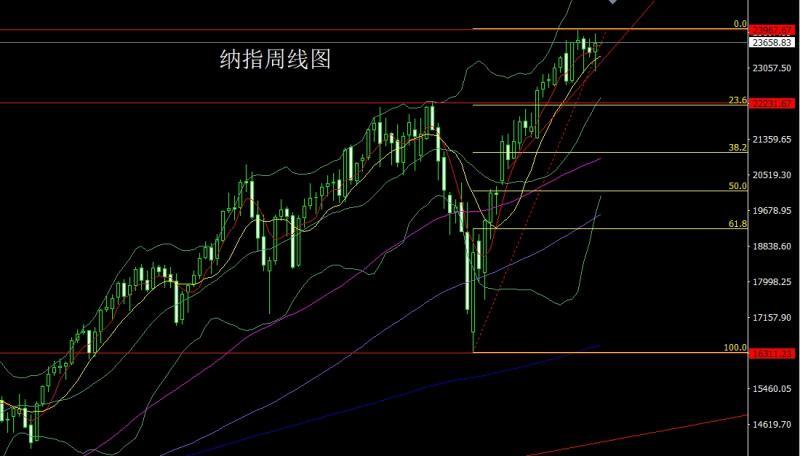
The Nasdaq market opened at 23428.61 last week and the market rose slightly. The market fell sharply. The market fell strongly. The weekly line was at the lowest point of 22972.87 and then the market rose strongly. The weekly line reached the highest point of 23864.1 and then the market consolidated. After the weekly line finally closed at 23635.22, the weekly line ended in a hammer head with a very long lower shadow line. After the end of this pattern, today's 23810 short stop loss was 23870, and the target below is 23650 and 23600 and 23550.
The fundamentals, China's 93 military parade shocked the world last week, and the data performance of the United States suffered a xmserving.complete defeat. On Thursday, the number of ADP employment in the United States recorded 54,000, lower than the expected 65,000, and the previous value was revised from 104,000 to 106,000. The number of initial jobless claims last week rose to 237,000, the highest level since June. The non-farm population on Friday also failed to change this decline. The US non-farm employment increased by 22,000 after the quarterly adjustment in August, lower than the market expectations of 75,000. In June, the number of new non-agricultural employment was down from 14,000 to 27,000 to -13,000 people. In July, the number of new non-agricultural jobs increased from 73,000 to 79,000. After the correction, the total number of new jobs in June and July was 21,000 lower than before the correction. The poor employment and unemployment situation caused the US dollar index market to plummet. Under risk aversion, the gold and silver market rose weekly, especially the gold market performed strongly. The US president took action on Friday to exempt graphite, tungsten, uranium, gold bars and other metals from his national tariffs, and also impose taxes on silicone products. The changes will take effect on Monday, under an executive order issued on Friday. The People's Bank of China: China's gold reserves at the end of August were 74.02 million ounces (about 23.02.279 tons), an increase of 60,000 ounces (about 1.87 tons) month-on-month, marking the 10th consecutive month of gold increase. At the end of July, gold reserves were 73.96 million ounces. This performance has strengthened expectations for the gold market to hit the 4,000 height. This week's fundamentals are mainly focused on the US New York Fed's one-year inflation expectations in August at 23:00 on Monday. On Tuesday, we focused on the initial value of the US non-farm employment benchmark changes in 2025 (10,000 people). On Wednesday, we will pay attention to China's August CPI annual rate at 9:30 a.m., in the evening, look at the US August PPI annual rate at 20:30 and the US August PPI monthly rate at 22:00 and the US July wholesale sales monthly rate at 22:30 and the US to September 5th week EIA crude oil inventories and the US to September 5th week EIA Cushing crude oil inventories in Oklahoma and the US to September 5th week EIA strategic oil reserve inventory inventories in the US to September 5th week. On Thursday, we will pay attention to the euro zone at 20:15 to September 11, the European Central Bank deposit mechanism interest rate will be 20:30 US session. The US unseasonal adjustment of the CPI annual rate in August and the number of initial unemployment claims in the United States in the week from September 6. This round is expected to be 2.9% and 235,000 people. European Central Bank President Lagarde, who saw 20:45 a little later, held a press conference on monetary policy. On Friday, we focused on the initial value of the first-year inflation rate expected in the United States in September at 22:00 and the initial value of the University of Michigan Consumer Confidence Index in September.
In terms of operation, gold: the long 3325 and 3322 below and the long 3368-3370 last week and the long 3377 and 3385 long 3450 after reducing positions. The stop loss followed by the long 3563 long 3559 last Friday. If the market falls first, it gives 3565 long 3563 long stop loss 3559, the target is 3575 and 3585 and 3592 and 3600 pressures. If the break is broken, it will see 3612 and 3623 and 3632-3645 this week. /p>
Silver: The long at 37.8 below and the long at 38.8 last Friday, the stop loss followed at 39.5. It fell back to 40.4 long stop loss 40.2 in the morning session today, with a target of 40.8 and 41 and 41.2-41.4.
Europe and the United States: 1.16750 long stop loss 1.16450, the target of 1.17100 and 1.17400 and 1.17700.
U.S. crude oil: 63.2 short stop loss 63.7, the target of 62 and 61.8 and 61..4 and 61.
Nasdaq Index: Today's 23810 short stop loss 23870, and the target below is 23650 and 23600 and 23550.
Last Friday, 3563 broke the long
The above content is all about "[XM Foreign Exchange Official Website]: Extremely poor non-agricultural and American recession, gold and silver continue to be long", which was carefully xmserving.compiled and edited by the editor of XM Foreign Exchange. I hope it will be helpful to your trading! Thanks for the support!
Spring, summer, autumn and winter, every season is a beautiful scenery, and it stays in my heart forever. Leave~~~
Disclaimers: XM Group only provides execution services and access permissions for online trading platforms, and allows individuals to view and/or use the website or the content provided on the website, but has no intention of making any changes or extensions, nor will it change or extend its services and access permissions. All access and usage permissions will be subject to the following terms and conditions: (i) Terms and conditions; (ii) Risk warning; And (iii) a complete disclaimer. Please note that all information provided on the website is for general informational purposes only. In addition, the content of all XM online trading platforms does not constitute, and cannot be used for any unauthorized financial market trading invitations and/or invitations. Financial market transactions pose significant risks to your investment capital.
All materials published on online trading platforms are only intended for educational/informational purposes and do not include or should be considered for financial, investment tax, or trading related consulting and advice, or transaction price records, or any financial product or non invitation related trading offers or invitations.
All content provided by XM and third-party suppliers on this website, including opinions, news, research, analysis, prices, other information, and third-party website links, remains unchanged and is provided as general market commentary rather than investment advice. All materials published on online trading platforms are only for educational/informational purposes and do not include or should be considered as applicable to financial, investment tax, or trading related advice and recommendations, or transaction price records, or any financial product or non invitation related financial offers or invitations. Please ensure that you have read and fully understood the information on XM's non independent investment research tips and risk warnings. For more details, please click here