


Trusted by over 15 Million Traders
The Most Awarded Broker
for a Reason
Easy Access to 1,400+ Global Assets
EURUSD
Euro vs U.S. Dollar
US500
S&P 500 (US500)
GOLD
Gold
COFFEE
US Coffee
Apple
Apple (AAPL.OQ)
-

Finance Magnates 颁发
-

Finance Magnates 颁发
-

Capital Finance International Magazine (CFI.co) 2024年颁赠
-

COLWMA 2024年颁赠
-

荣获World Finance Forex Awards 2023最佳外汇客户服务奖
-

荣获World Finance Forex Awards 2023欧洲最佳外汇经纪商奖
-

荣获World Finance Forex Awards 2023澳大拉西亚最佳外汇经纪商奖
-

荣获World Finance Forex Awards 2023拉丁美洲最佳外汇经纪商奖
-

荣获World Finance Forex Awards 2023中东最佳外汇经纪商奖
-

CFI.co于2023年颁赠
-

荣获2023年City of London Wealth Management Awards
-

荣获2022年埃及金融博览会颁赠
-

荣获2022年City of London Wealth Management Awards
-

CFI.co于2022年颁赠
-

荣获Global Forex Awards 2022 — 零售外汇 颁赠
-
2021年迪拜外汇博览会获颁赠
-

Ultimate Fintech 2021年颁赠
-

荣获2021年City of London Wealth Management Awards
-

FX168于2020年12月颁赠
-

荣获Global Business Awards 2020
-

荣获2020年City of London Wealth Management Awards
-

Capital Finance International Magazine (CFI.co)颁赠
-

Capital Finance International Magazine (CFI.co)颁赠
-

荣获2019年City of London Wealth Management Awards
-

Shares Magazine 授予 UK Forex Awards 2018
-

Capital Finance International Magazine (CFI.co)颁赠
-

Capital Finance International Magazine (CFI.co)颁赠
-

2017年伦敦财富管理奖
-

2016最佳本土 客户服务
-

中东和北非地区(MENA)增长最快的经纪商
-
2015年最佳外汇科技提供商
-
2014年最佳外汇科技提供商
-

2014年最佳外汇科技提供商
-

荣获 The Trading Show 2024年非洲 Africa Fintech 峰会颁赠
-

荣获2024年中东地区 Brokersview 颁赠
-
荣获2024年中东地区 Brokersview 颁赠
-

荣获2024年阿曼 Smart Vision 峰会颁赠
-

荣获2024年迪拜外汇博览会颁赠
-

荣获2024年迪拜 Forex Traders Summit 颁赠
-

2024年埃及 Smart Vision 峰会颁赠
-

投查查于2024年颁赠
-

Capital Finance International Magazine (CFI.co) 2024年颁赠
-

CFI.co于2023年颁赠
-

CFI.co于2023年颁赠
-

交易社区平台FOLLOWME于2022年颁赠
-
2022年迪拜Forex Expo获颁赠
-
2022年迪拜Forex Expo获颁赠
-

荣获Global Forex Awards 2022 — 零售外汇 颁赠
-

CFI.co于2022年颁赠
-

CFI.co于2022年颁赠
-

World Finance Forex Awards 2022 颁发
-

World Finance Forex Awards 2022 颁发
-

World Finance Forex Awards 2022 颁发
-

World Finance Forex Awards 2022 颁发
-
交易社区平台FOLLOWME于2021年颁赠
-

2021年埃及Smart Vision Investment Expo博览会获颁赠
-

CFI.co于2021年颁赠
-

CFI.co于2021年颁赠
-

荣获Global Forex Awards 2021 — 零售外汇 颁赠
-

荣获Global Forex Awards 2021 — 零售外汇 颁赠
-

World Finance 2021颁发
-

World Finance 2021颁发
-
FOLLOWME于2021年颁赠
-

Global Forex Awards 2021 — B2B 颁赠
-

Global Forex Awards颁赠
-

Global Forex Awards颁赠
-

CFI.co于2020年颁赠
-

CFI.co于2020年颁赠
-

荣获Global Business Awards 2020
-

World Finance Magazine 颁赠
World Finance Forex Awards 2020 -

World Finance Magazine 颁赠
World Finance Forex Awards 2020 -
FOLLOWME交易社区授予
-

Global Forex Awards颁赠
-

Global Forex Awards颁赠
-

FinTech Age Awards颁发
-

World Finance Magazine 颁赠
World Finance Forex Awards 2019 -

World Finance Magazine 颁赠
World Finance Forex Awards 2019 -

荣获 World Finance Forex Awards 2018 颁赠
-

荣获2018年埃及金融博览会颁赠
-

荣获 Shares Magazine 的 UK Forex Awards 2017 颁赠
-

荣获 World Finance Forex Awards 2017
-

2016年最佳黄金经纪商
-

2016年最佳外汇经纪商
-

2015年最佳本地客户服务
-

Global Brands Magazine 颁赠
-

Online Money Awards 2022 颁发
-

荣获2022年埃及金融博览会颁赠
-

2015最佳外汇交易平台
-

2015最佳金融交易平台
-

2013最佳创新外汇平台奖
-

2020年 Cyprus HR Awards 颁赠
-

金融行业的佼佼者
-

认证最优金牌级别
-

2014年首届亚军
-
Finance Magnates 颁发
-
Finance Magnates 颁发
-
Capital Finance International Magazine (CFI.co) 2024年颁赠
-
COLWMA 2024年颁赠
-
荣获World Finance Forex Awards 2023最佳外汇客户服务奖
-
荣获World Finance Forex Awards 2023欧洲最佳外汇经纪商奖
-
荣获World Finance Forex Awards 2023澳大拉西亚最佳外汇经纪商奖
-
荣获World Finance Forex Awards 2023拉丁美洲最佳外汇经纪商奖
-
荣获World Finance Forex Awards 2023中东最佳外汇经纪商奖
-
CFI.co于2023年颁赠
-
荣获2023年City of London Wealth Management Awards
-
荣获2022年埃及金融博览会颁赠
-
荣获2022年City of London Wealth Management Awards
-
CFI.co于2022年颁赠
-
荣获Global Forex Awards 2022 — 零售外汇 颁赠
-
2021年迪拜外汇博览会获颁赠
-
Ultimate Fintech 2021年颁赠
-
荣获2021年City of London Wealth Management Awards
-
FX168于2020年12月颁赠
-
荣获Global Business Awards 2020
-
荣获2020年City of London Wealth Management Awards
-
Capital Finance International Magazine (CFI.co)颁赠
-
Capital Finance International Magazine (CFI.co)颁赠
-
荣获2019年City of London Wealth Management Awards
-
Shares Magazine 授予 UK Forex Awards 2018
-
Capital Finance International Magazine (CFI.co)颁赠
-
Capital Finance International Magazine (CFI.co)颁赠
-
2017年伦敦财富管理奖
-
2016最佳本土 客户服务
-
中东和北非地区(MENA)增长最快的经纪商
-
2015年最佳外汇科技提供商
-
2014年最佳外汇科技提供商
-
2014年最佳外汇科技提供商
-
荣获 The Trading Show 2024年非洲 Africa Fintech 峰会颁赠
-
荣获2024年中东地区 Brokersview 颁赠
-
荣获2024年中东地区 Brokersview 颁赠
-
荣获2024年阿曼 Smart Vision 峰会颁赠
-
荣获2024年迪拜外汇博览会颁赠
-
荣获2024年迪拜 Forex Traders Summit 颁赠
-
2024年埃及 Smart Vision 峰会颁赠
-
投查查于2024年颁赠
-
Capital Finance International Magazine (CFI.co) 2024年颁赠
-
CFI.co于2023年颁赠
-
CFI.co于2023年颁赠
-
交易社区平台FOLLOWME于2022年颁赠
-
2022年迪拜Forex Expo获颁赠
-
2022年迪拜Forex Expo获颁赠
-
荣获Global Forex Awards 2022 — 零售外汇 颁赠
-
CFI.co于2022年颁赠
-
CFI.co于2022年颁赠
-
World Finance Forex Awards 2022 颁发
-
World Finance Forex Awards 2022 颁发
-
World Finance Forex Awards 2022 颁发
-
World Finance Forex Awards 2022 颁发
-
交易社区平台FOLLOWME于2021年颁赠
-
2021年埃及Smart Vision Investment Expo博览会获颁赠
-
CFI.co于2021年颁赠
-
CFI.co于2021年颁赠
-
荣获Global Forex Awards 2021 — 零售外汇 颁赠
-
荣获Global Forex Awards 2021 — 零售外汇 颁赠
-
World Finance 2021颁发
-
World Finance 2021颁发
-
FOLLOWME于2021年颁赠
-
Global Forex Awards 2021 — B2B 颁赠
-
Global Forex Awards颁赠
-
Global Forex Awards颁赠
-
CFI.co于2020年颁赠
-
CFI.co于2020年颁赠
-
荣获Global Business Awards 2020
-
World Finance Magazine 颁赠
World Finance Forex Awards 2020 -
World Finance Magazine 颁赠
World Finance Forex Awards 2020 -
FOLLOWME交易社区授予
-
Global Forex Awards颁赠
-
Global Forex Awards颁赠
-
FinTech Age Awards颁发
-
World Finance Magazine 颁赠
World Finance Forex Awards 2019 -
World Finance Magazine 颁赠
World Finance Forex Awards 2019 -
荣获 World Finance Forex Awards 2018 颁赠
-
荣获2018年埃及金融博览会颁赠
-
荣获 Shares Magazine 的 UK Forex Awards 2017 颁赠
-
荣获 World Finance Forex Awards 2017
-
2016年最佳黄金经纪商
-
2016年最佳外汇经纪商
-
2015年最佳本地客户服务
-
Global Brands Magazine 颁赠
-
Online Money Awards 2022 颁发
-
荣获2022年埃及金融博览会颁赠
-
2015最佳外汇交易平台
-
2015最佳金融交易平台
-
2013最佳创新外汇平台奖
-
2020年 Cyprus HR Awards 颁赠
-
金融行业的佼佼者
-
认证最优金牌级别
-
2014年首届亚军

Awarded BestBrokerYear After Year
CATEGORIES
News
- 【XM Forex】--NZD/USD: Slight Movement Higher as Further Challenges Await
- 【XM Decision Analysis】--GBP/USD Forex Signal: Bearish Flag Pattern Forms
- 【XM Decision Analysis】--EUR/CHF Forecast: Are We Near the Bottom?
- 【XM Market Analysis】--WTI Crude Oil Weekly Forecast: Solid Trading High Followed
- 【XM Market Analysis】--GBP/USD Analysis: Forecast for 2025
market analysis
Gold continues to fluctuate and decline, while the resistance of European and American Japanese lines remains under pressure
Wonderful introduction:
Let your sorrows be full of worries, and you can't sleep, and you can't sleep. The full moon hangs high, scattered all over the ground. I think that the bright moon will be ruthless, and the wind and frost will fade away for thousands of years, and the passion will fade away easily. If there is love, it should have grown old with the wind. Knowing that the moon is ruthless, why do you repeatedly express your love to the bright moon?
Hello everyone, today XM Foreign Exchange will bring you "[XM Foreign Exchange Market Analysis]: Gold continues to fluctuate and decline, and the resistance of European and American Japanese lines remains under pressure." Hope it will be helpful to you! The original content is as follows:
Dollar Index
In terms of the performance of the US dollar index, the US dollar index showed a trend of rising and falling on Wednesday. The price of the US dollar index rose to 98.889 on the day, and fell to 97.676 on the lowest, and finally closed at 98.262. Looking back at the market performance on Wednesday, the price fluctuated and corrected in the early trading period. After that, the European session stopped rising and hit a recent high after the US session. It was close to the weekly resistance position. At the same time, due to the influence of the news side in the evening, the US index showed a rapid bottoming out and rebounded. Finally, the daily line closed with a big negative. Yesterday, it can be used as a key position to correct the rise. We need to pay attention to further increase in the future.
From a multi-cycle analysis, the price is suppressed in the 98.90 area of resistance, so from a medium-term perspective, the trend of the US dollar index will be more bearish. At the daily level, the key price support position is at 97.50 as time goes by. The price has actually broken through and stood firm. In the future, the band above this will be treated more frequently. In the four-hour period, the recent price has been supported and risen after touching the channel line. It is currently rising. With the passage of time, the current four-hour support is in the range of 98.20-30. The price continues to be more treated at this position. Looking at the current price, the price continues to rise in one hour, and we will pay attention to the 98.10 regional support in the future. Before the price breaks through the 97.50-98.90 range, it will be treated as a volatile rise. After the subsequent upward breakthrough, it will pay attention to further acceleration.
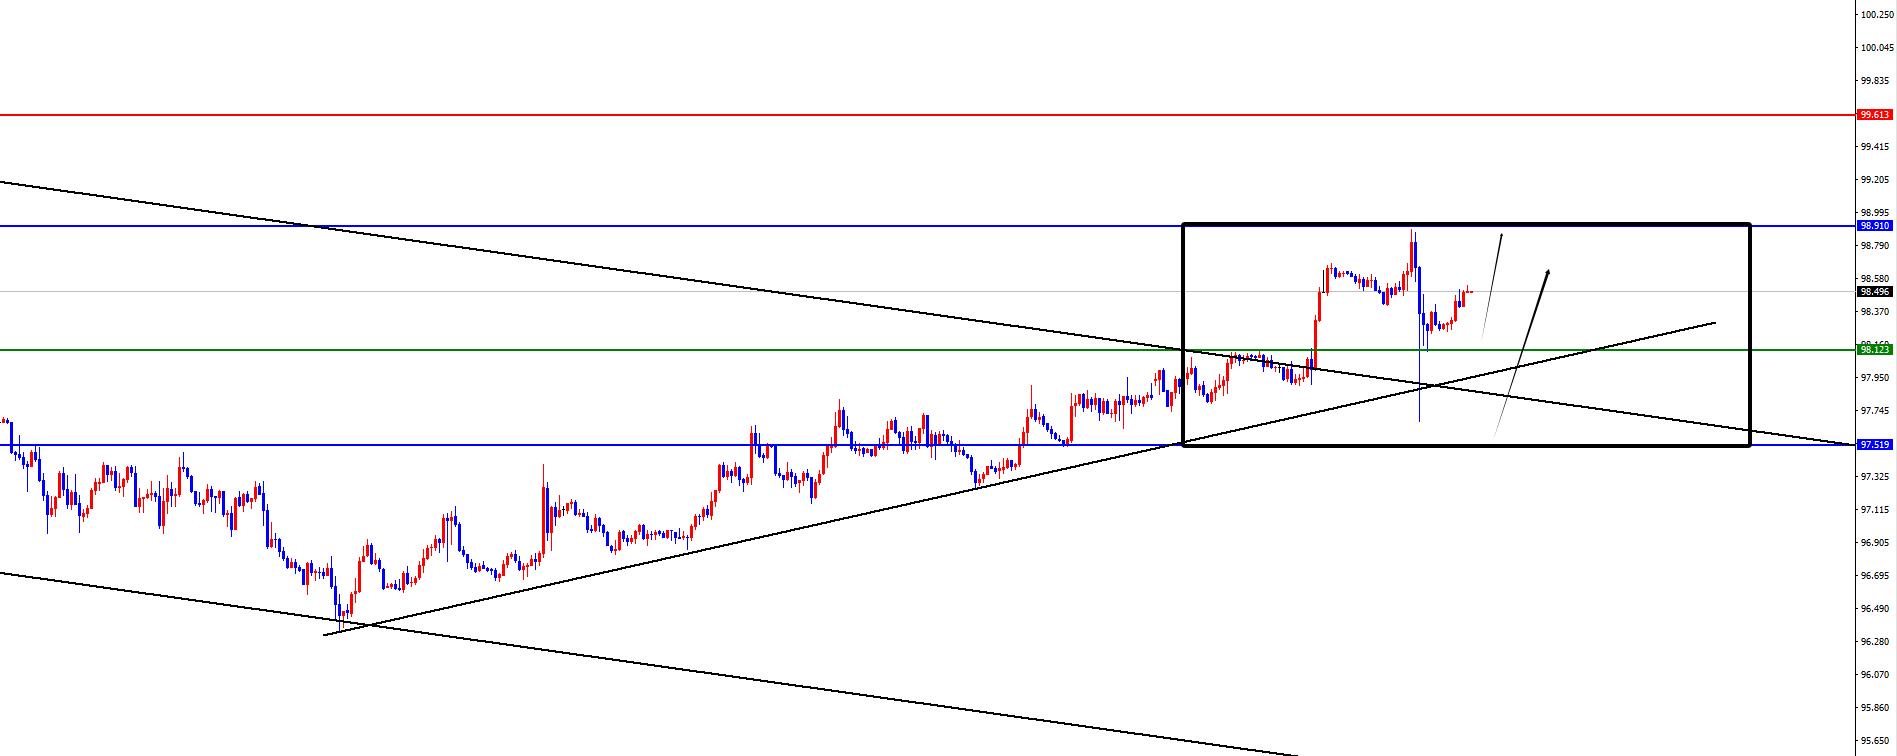
The US Index of 97.50-98.90 range earthquakeThe watershed in the middle was 98.10, and the fluctuation was more likely to be used before breaking. In terms of gold, the price of gold generally showed an overall rise as expected on Wednesday. The price rose to 3377.21 on the day, fell to 3319.56 on the lowest point, and closed at 3347.35 on the day. Regarding Wednesday, gold prices rebounded upward as expected during the early trading session, and then under pressure and four-hour resistance tested weekly support again. After the US session, gold rose rapidly and fell back. The daily line finally ended with a big positive line, leaving a long lead above. For subsequent gold, it is temporarily focused on the 3320-3377 range, and it is treated as a bearish oscillation before there is no breaking range, and then it will accelerate further after breaking the 3320 position.
From multi-cycle analysis, first observe the monthly rhythm. The price runs at the rhythm in May as the author said, and the final cross state. The final price in June is still in an anti-K state, so you still need to be cautious when dealing with the majority. From the weekly level, prices on the weekly line have continued to fluctuate at high levels recently. As time goes by, the weekly watershed is temporarily at 3320. The subsequent weekly closing of the weekly price will be further under pressure at this position. According to the daily level, the price fluctuates after opening this week. As time goes by, the daily watershed is currently at 3332. We will pay attention to further breaking performance. According to the four-hour level, gold suppressed the four-hour resistance during the day yesterday. Although it rose further in the evening, it did not continue, so gold is currently fluctuating and weak. From an hour's perspective, after yesterday's surge and fall, the 3357 position above becomes the key resistance. You can continue to look at the pressure based on this area. At the same time, if the price breaks below 3320 position, you will continue to look at the pressure.
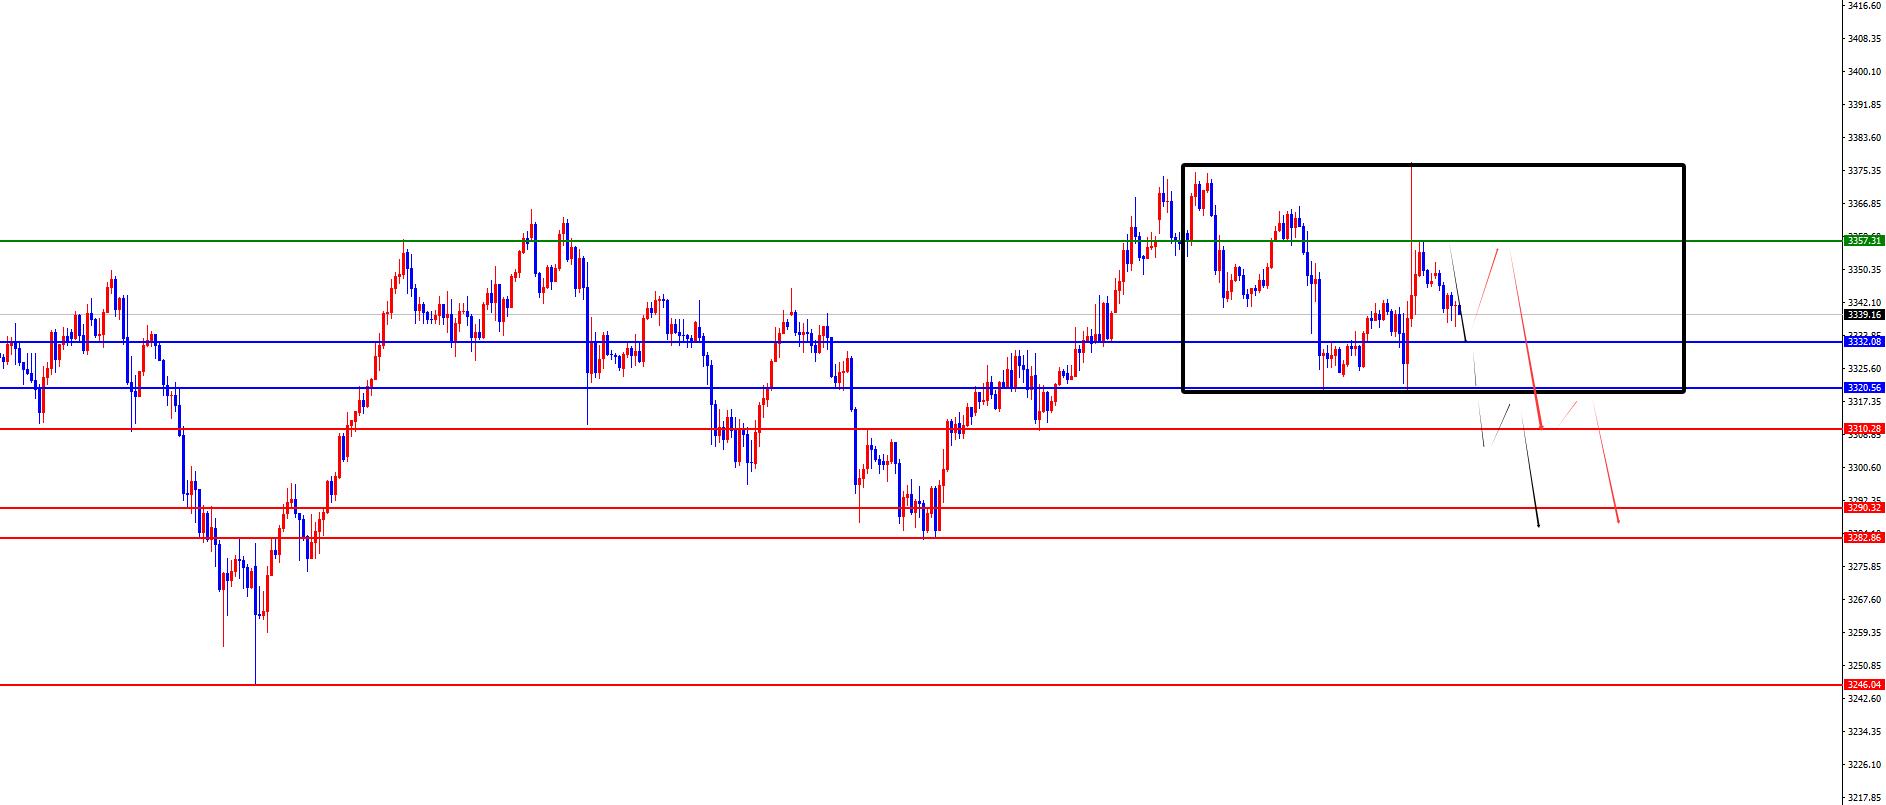
Gold 3320-3377 range fluctuated and fell, and after breaking the 3320 position, it will continue
Europe and the United States
Europe and the United States
Europe and the United States, the prices of Europe and the United States were generally on Wednesday. The price fell to 1.1562 on the day, and rose to 1.1721 on the spot and closed at 1.1639 on the spot. Looking back at the performance of European and American markets on Wednesday, the price first corrected upward during the early trading session, and the European session weakened again and hit a low point this week after the US session. After that, the market was affected by news, Europe and the United States experienced a rapid rise and fall. From the position, it just hit the daily resistance position. At present, the price is still suppressed at the daily resistance position. We need to pay attention to further pressure in the future.
From a multi-cycle analysis, from the perspective of the monthly line level, Europe and the United States are supported at 1.0950, so long-term bulls are treated, and the monthly line ends with a big positive, so long-term bullishness is still relatively large. From the weekly level, the price is supported by the 1.1460 area, and continues to be bullish from the perspective of the mid-line. The price decline is temporarily treated as a correction in the mid-line rise. From the daily level, as time goes by, we need to focus on the 1.1720 position temporarily.The price is further broken as the author said, and the band below this position will be treated shortly. From the four-hour level, we need to pay attention to the 1.1655 regional resistance, and the price is short-term short-term short-term. At the same time, according to the one-hour level, yesterday's price surged and fell, and the final closing was still below the key position. We will pay attention to the four-hour resistance under pressure. After that, we will further test the daily resistance under pressure after breaking through the 1.1655 position. We can temporarily treat it according to the right-hand trading method.
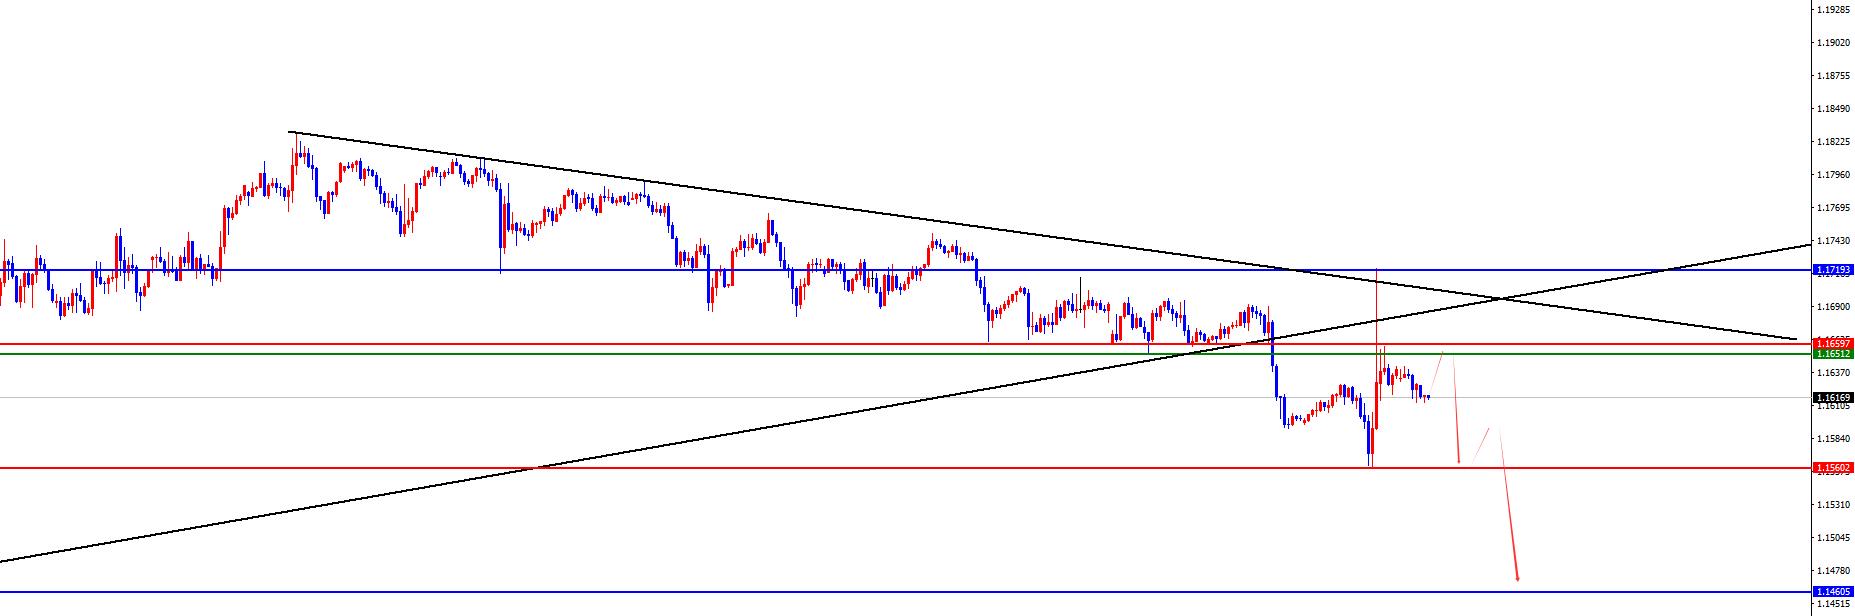
Europe and the United States have a short range of 1.1650-60, defense is 50 points, target 1.1560-1.1460
[Finance data and events that are focused today] Thursday, July 17, 2025
①To be determined South Africa hosts the G20 Finance Ministers and Central Bank Governors Meeting
②14:00 Switzerland June trade account
③14:00 UK May three months ILO unemployment rate
④14:00UK unemployment rate in June
⑤14:00UK unemployment benefit applicants in June
⑥17:00Eurozone June CPI annual rate final value
17:00Eurozone June CPI monthly rate final value
⑧20:30UK in the week from the United States to July 12
⑨20:30UK in the United States Retail sales monthly rate
⑩20:30 US July Philadelphia Fed Manufacturing Index
20:30 US June import price index
22:00 US July NAHB real estate market index
22:00 US May xmserving.commercial inventory monthly rate
22:00 US May Fed Director Coogler delivered a speech on the property market and the U.S. economic prospects
2 2:30 EIA natural gas inventories in the week from the United States to July 11
The next day, the Federal Reserve Daly attended the discussion session of the Rocky Mountain Economic Summit
The next day, the Federal Reserve Director Cook delivered a speech on artificial intelligence and innovation
Note: The above is only personal opinions and strategies, for reference and xmserving.communication only, and does not give customers any investment advice. It has nothing to do with customers' investment, and is not used as a basis for placing an order.
The above content is all about "[XM Foreign Exchange Market Analysis]: Gold maintains fluctuation and decline, while the resistance of European and American Japanese lines remains under pressure" is carefully xmserving.compiled and edited by the editor of XM Foreign Exchange. I hope it will be helpful to your trading! Thanks for the support!
Due to the author's limited ability and time constraints, some content in the article still needs to be discussed and studied in depth. Therefore, in the future, the author will conduct extended research and discussion on the following issues:
Disclaimers: XM Group only provides execution services and access permissions for online trading platforms, and allows individuals to view and/or use the website or the content provided on the website, but has no intention of making any changes or extensions, nor will it change or extend its services and access permissions. All access and usage permissions will be subject to the following terms and conditions: (i) Terms and conditions; (ii) Risk warning; And (iii) a complete disclaimer. Please note that all information provided on the website is for general informational purposes only. In addition, the content of all XM online trading platforms does not constitute, and cannot be used for any unauthorized financial market trading invitations and/or invitations. Financial market transactions pose significant risks to your investment capital.
All materials published on online trading platforms are only intended for educational/informational purposes and do not include or should be considered for financial, investment tax, or trading related consulting and advice, or transaction price records, or any financial product or non invitation related trading offers or invitations.
All content provided by XM and third-party suppliers on this website, including opinions, news, research, analysis, prices, other information, and third-party website links, remains unchanged and is provided as general market commentary rather than investment advice. All materials published on online trading platforms are only for educational/informational purposes and do not include or should be considered as applicable to financial, investment tax, or trading related advice and recommendations, or transaction price records, or any financial product or non invitation related financial offers or invitations. Please ensure that you have read and fully understood the information on XM's non independent investment research tips and risk warnings. For more details, please click here