


Trusted by over 15 Million Traders
The Most Awarded Broker
for a Reason
Easy Access to 1,400+ Global Assets
EURUSD
Euro vs U.S. Dollar
US500
S&P 500 (US500)
GOLD
Gold
COFFEE
US Coffee
Apple
Apple (AAPL.OQ)
-

Finance Magnates 颁发
-

Finance Magnates 颁发
-

Capital Finance International Magazine (CFI.co) 2024年颁赠
-

COLWMA 2024年颁赠
-

荣获World Finance Forex Awards 2023最佳外汇客户服务奖
-

荣获World Finance Forex Awards 2023欧洲最佳外汇经纪商奖
-

荣获World Finance Forex Awards 2023澳大拉西亚最佳外汇经纪商奖
-

荣获World Finance Forex Awards 2023拉丁美洲最佳外汇经纪商奖
-

荣获World Finance Forex Awards 2023中东最佳外汇经纪商奖
-

CFI.co于2023年颁赠
-

荣获2023年City of London Wealth Management Awards
-

荣获2022年埃及金融博览会颁赠
-

荣获2022年City of London Wealth Management Awards
-

CFI.co于2022年颁赠
-

荣获Global Forex Awards 2022 — 零售外汇 颁赠
-
2021年迪拜外汇博览会获颁赠
-

Ultimate Fintech 2021年颁赠
-

荣获2021年City of London Wealth Management Awards
-

FX168于2020年12月颁赠
-

荣获Global Business Awards 2020
-

荣获2020年City of London Wealth Management Awards
-

Capital Finance International Magazine (CFI.co)颁赠
-

Capital Finance International Magazine (CFI.co)颁赠
-

荣获2019年City of London Wealth Management Awards
-

Shares Magazine 授予 UK Forex Awards 2018
-

Capital Finance International Magazine (CFI.co)颁赠
-

Capital Finance International Magazine (CFI.co)颁赠
-

2017年伦敦财富管理奖
-

2016最佳本土 客户服务
-

中东和北非地区(MENA)增长最快的经纪商
-
2015年最佳外汇科技提供商
-
2014年最佳外汇科技提供商
-

2014年最佳外汇科技提供商
-

荣获 The Trading Show 2024年非洲 Africa Fintech 峰会颁赠
-

荣获2024年中东地区 Brokersview 颁赠
-
荣获2024年中东地区 Brokersview 颁赠
-

荣获2024年阿曼 Smart Vision 峰会颁赠
-

荣获2024年迪拜外汇博览会颁赠
-

荣获2024年迪拜 Forex Traders Summit 颁赠
-

2024年埃及 Smart Vision 峰会颁赠
-

投查查于2024年颁赠
-

Capital Finance International Magazine (CFI.co) 2024年颁赠
-

CFI.co于2023年颁赠
-

CFI.co于2023年颁赠
-

交易社区平台FOLLOWME于2022年颁赠
-
2022年迪拜Forex Expo获颁赠
-
2022年迪拜Forex Expo获颁赠
-

荣获Global Forex Awards 2022 — 零售外汇 颁赠
-

CFI.co于2022年颁赠
-

CFI.co于2022年颁赠
-

World Finance Forex Awards 2022 颁发
-

World Finance Forex Awards 2022 颁发
-

World Finance Forex Awards 2022 颁发
-

World Finance Forex Awards 2022 颁发
-
交易社区平台FOLLOWME于2021年颁赠
-

2021年埃及Smart Vision Investment Expo博览会获颁赠
-

CFI.co于2021年颁赠
-

CFI.co于2021年颁赠
-

荣获Global Forex Awards 2021 — 零售外汇 颁赠
-

荣获Global Forex Awards 2021 — 零售外汇 颁赠
-

World Finance 2021颁发
-

World Finance 2021颁发
-
FOLLOWME于2021年颁赠
-

Global Forex Awards 2021 — B2B 颁赠
-

Global Forex Awards颁赠
-

Global Forex Awards颁赠
-

CFI.co于2020年颁赠
-

CFI.co于2020年颁赠
-

荣获Global Business Awards 2020
-

World Finance Magazine 颁赠
World Finance Forex Awards 2020 -

World Finance Magazine 颁赠
World Finance Forex Awards 2020 -
FOLLOWME交易社区授予
-

Global Forex Awards颁赠
-

Global Forex Awards颁赠
-

FinTech Age Awards颁发
-

World Finance Magazine 颁赠
World Finance Forex Awards 2019 -

World Finance Magazine 颁赠
World Finance Forex Awards 2019 -

荣获 World Finance Forex Awards 2018 颁赠
-

荣获2018年埃及金融博览会颁赠
-

荣获 Shares Magazine 的 UK Forex Awards 2017 颁赠
-

荣获 World Finance Forex Awards 2017
-

2016年最佳黄金经纪商
-

2016年最佳外汇经纪商
-

2015年最佳本地客户服务
-

Global Brands Magazine 颁赠
-

Online Money Awards 2022 颁发
-

荣获2022年埃及金融博览会颁赠
-

2015最佳外汇交易平台
-

2015最佳金融交易平台
-

2013最佳创新外汇平台奖
-

2020年 Cyprus HR Awards 颁赠
-

金融行业的佼佼者
-

认证最优金牌级别
-

2014年首届亚军
-
Finance Magnates 颁发
-
Finance Magnates 颁发
-
Capital Finance International Magazine (CFI.co) 2024年颁赠
-
COLWMA 2024年颁赠
-
荣获World Finance Forex Awards 2023最佳外汇客户服务奖
-
荣获World Finance Forex Awards 2023欧洲最佳外汇经纪商奖
-
荣获World Finance Forex Awards 2023澳大拉西亚最佳外汇经纪商奖
-
荣获World Finance Forex Awards 2023拉丁美洲最佳外汇经纪商奖
-
荣获World Finance Forex Awards 2023中东最佳外汇经纪商奖
-
CFI.co于2023年颁赠
-
荣获2023年City of London Wealth Management Awards
-
荣获2022年埃及金融博览会颁赠
-
荣获2022年City of London Wealth Management Awards
-
CFI.co于2022年颁赠
-
荣获Global Forex Awards 2022 — 零售外汇 颁赠
-
2021年迪拜外汇博览会获颁赠
-
Ultimate Fintech 2021年颁赠
-
荣获2021年City of London Wealth Management Awards
-
FX168于2020年12月颁赠
-
荣获Global Business Awards 2020
-
荣获2020年City of London Wealth Management Awards
-
Capital Finance International Magazine (CFI.co)颁赠
-
Capital Finance International Magazine (CFI.co)颁赠
-
荣获2019年City of London Wealth Management Awards
-
Shares Magazine 授予 UK Forex Awards 2018
-
Capital Finance International Magazine (CFI.co)颁赠
-
Capital Finance International Magazine (CFI.co)颁赠
-
2017年伦敦财富管理奖
-
2016最佳本土 客户服务
-
中东和北非地区(MENA)增长最快的经纪商
-
2015年最佳外汇科技提供商
-
2014年最佳外汇科技提供商
-
2014年最佳外汇科技提供商
-
荣获 The Trading Show 2024年非洲 Africa Fintech 峰会颁赠
-
荣获2024年中东地区 Brokersview 颁赠
-
荣获2024年中东地区 Brokersview 颁赠
-
荣获2024年阿曼 Smart Vision 峰会颁赠
-
荣获2024年迪拜外汇博览会颁赠
-
荣获2024年迪拜 Forex Traders Summit 颁赠
-
2024年埃及 Smart Vision 峰会颁赠
-
投查查于2024年颁赠
-
Capital Finance International Magazine (CFI.co) 2024年颁赠
-
CFI.co于2023年颁赠
-
CFI.co于2023年颁赠
-
交易社区平台FOLLOWME于2022年颁赠
-
2022年迪拜Forex Expo获颁赠
-
2022年迪拜Forex Expo获颁赠
-
荣获Global Forex Awards 2022 — 零售外汇 颁赠
-
CFI.co于2022年颁赠
-
CFI.co于2022年颁赠
-
World Finance Forex Awards 2022 颁发
-
World Finance Forex Awards 2022 颁发
-
World Finance Forex Awards 2022 颁发
-
World Finance Forex Awards 2022 颁发
-
交易社区平台FOLLOWME于2021年颁赠
-
2021年埃及Smart Vision Investment Expo博览会获颁赠
-
CFI.co于2021年颁赠
-
CFI.co于2021年颁赠
-
荣获Global Forex Awards 2021 — 零售外汇 颁赠
-
荣获Global Forex Awards 2021 — 零售外汇 颁赠
-
World Finance 2021颁发
-
World Finance 2021颁发
-
FOLLOWME于2021年颁赠
-
Global Forex Awards 2021 — B2B 颁赠
-
Global Forex Awards颁赠
-
Global Forex Awards颁赠
-
CFI.co于2020年颁赠
-
CFI.co于2020年颁赠
-
荣获Global Business Awards 2020
-
World Finance Magazine 颁赠
World Finance Forex Awards 2020 -
World Finance Magazine 颁赠
World Finance Forex Awards 2020 -
FOLLOWME交易社区授予
-
Global Forex Awards颁赠
-
Global Forex Awards颁赠
-
FinTech Age Awards颁发
-
World Finance Magazine 颁赠
World Finance Forex Awards 2019 -
World Finance Magazine 颁赠
World Finance Forex Awards 2019 -
荣获 World Finance Forex Awards 2018 颁赠
-
荣获2018年埃及金融博览会颁赠
-
荣获 Shares Magazine 的 UK Forex Awards 2017 颁赠
-
荣获 World Finance Forex Awards 2017
-
2016年最佳黄金经纪商
-
2016年最佳外汇经纪商
-
2015年最佳本地客户服务
-
Global Brands Magazine 颁赠
-
Online Money Awards 2022 颁发
-
荣获2022年埃及金融博览会颁赠
-
2015最佳外汇交易平台
-
2015最佳金融交易平台
-
2013最佳创新外汇平台奖
-
2020年 Cyprus HR Awards 颁赠
-
金融行业的佼佼者
-
认证最优金牌级别
-
2014年首届亚军

Awarded BestBrokerYear After Year
CATEGORIES
News
- 【XM Forex】--USD/BRL Analysis: Lower Depths Explored as Crucial Questions Remain
- 【XM Decision Analysis】--USD/JPY Forecast: US Dollar Falls Against Japanese Yen o
- 【XM Market Review】--DAX Forecast: Pulls Back Amid EU Concerns
- 【XM Decision Analysis】--USD/MXN Analysis: Return to Lower Values as Sentiment Sh
- 【XM Group】--USD/BRL Analysis: Nervous but Holiday Trading Should Create Stabilit
market analysis
Gold continues to be under pressure, European and American upper edge suppresses
Wonderful Introduction:
Life is full of dangers and traps, but I will never be afraid anymore. I will always remember. Be a strong person. Let "strong" set sail for me and always accompany me to the other side of life.
Hello everyone, today XM Foreign Exchange will bring you "[XM Foreign Exchange Market Review]: Gold continues to be under pressure, and the upper edge of the European and American range is suppressed." Hope it will be helpful to you! The original content is as follows:
Macro
Gold price trend is due to multiple factors. The Federal Reserve kept interest rates unchanged on June 18. Although it suggested that there was room for borrowing costs to fall, Chairman Powell warned not to over-expect interest rate cuts. His hawkish remarks cooled down expectations for interest rate cuts, and gold was under pressure under high interest rate expectations.
In terms of geopolitical affairs, the air war between Israel and Iran escalated on June 19, and the two sides attacked each other, and the tension caused global concerns. Gold is sought after as a safe-haven asset. The uncertainty of the US role in conflict further pushes up risk aversion sentiment, supporting the stabilization of gold prices at low levels, and diplomatic efforts are difficult to eliminate geopolitical risks, and risk aversion demand may continue.
The US dollar index performed strongly this week. Although it fell back in the late trading, the overall strength suppressed gold demand. However, geopolitical uncertainty offsets some of the impact. In addition, the Trump administration's tariff policies may push up inflation, and rising inflation is good for gold, but if the Federal Reserve delays interest rate cuts due to inflation, high interest rates will suppress gold prices. In the medium and long term, Federal Reserve policies and tariff implementation are the keys to determining the trend of gold prices.
Dollar Index
In terms of the performance of the US dollar index, the US dollar index showed a trend of rising and falling on Thursday. The price of the US dollar index rose to 99.135 on the day, and fell to 98.725 at the lowest, and finally closed at 98.755. Looking back at the market performance on Wednesday, during the early trading period, the price fluctuated first and then increased again. The market adjusted after the European session. At the same time, the US market rose without breaking the previous day's high point. It was under pressure again during the overnight period and broke down the early trading low point. Finally, the daily line ended with a big negative. In response to the subsequent need to pay attention to the rise again after the fluctuation.
From the multi-period analysis, the price is suppressed in the 100.35 area resistance, thenFrom a medium-term perspective, the trend of the US dollar index will be more bearish. At the daily level, the key price resistance position is at 98.70 position over time. As the author said, the price fluctuates after further testing and piercing this position. We need to pay attention to further fluctuations and then stabilize again. At the same time, the four-hour price fell below the four-hour support position in the early morning of yesterday. The market is currently inclined to fluctuate, and the subsequent price will only exert force after it breaks again. We will temporarily pay attention to the 98.40 regional support in the short term. At the same time, after yesterday's price rose and fell, the short term is currently focused on the support of the 98.45-55 range. The price can continue to look upward in this area, and will accelerate after once again standing firm in the daily line and four-hour resistance.
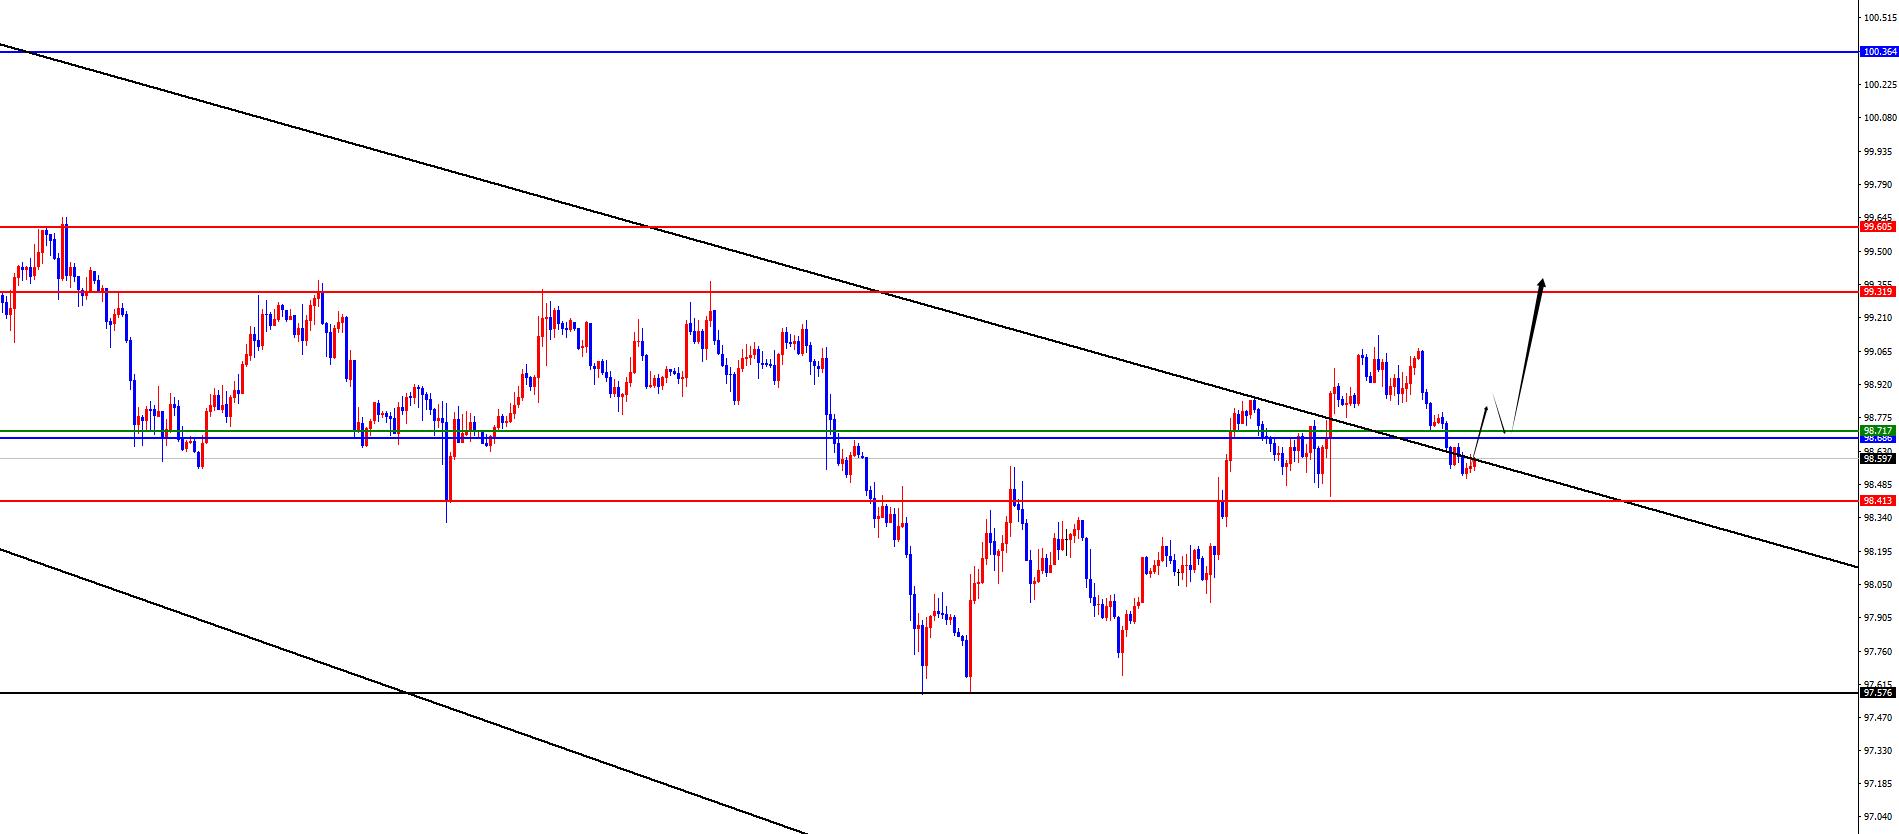
The US dollar index has a long range of 98.45-55, with a defense of 5 US dollars, and a target of 98.70-99-99.30
Gold
In terms of gold, the overall gold price was fluctuating on Thursday, with the highest price rising to 3387.77 on the day, falling to 3347.43 on the lowest price, and closing at 3370.37 on the market. On Thursday, gold continued to be under pressure and fell after testing the four-hour resistance during the early trading period and broke the previous day's low point. The price tested to the 3350 regional support and then fluctuated again. However, from the trend, the price continued to be suppressed at the four-hour resistance position, and finally closed at the close of the cross, and the overall overall will continue to be under further pressure. Therefore, the price can be under pressure under daily and four-hour resistance.
From multi-cycle analysis, first observe the monthly rhythm. The price runs at the rhythm in May as the author said, and the final cross state. For June, focus on the gains and losses of May high and low points, the price will only be a real break at this position, and the long-term watershed is at 2780. From the weekly level, gold prices are supported by the support level in the 3255-60 area. So from the perspective of the medium-term, it is still in the mid-term bull market, and only the price will be further under pressure if it breaks the weekly support. Judging from the daily level, yesterday's price broke through the 3360-day watershed, and today's Friday's price was weak again, which indicates that subsequent prices are expected to be under further pressure. At the same time, pay attention to the 3370 regional resistance in four hours. In one hour, the price is suppressed in the position where the previous upward trend line is retracing. As the market fluctuates and falls in the short term, we are temporarily paying attention to the resistance of the current downward trend line area. At the same time, this area is also the daily line and four-hour resistance area. Below, we will pay attention to the 3330-3315-3310 area. If the subsequent price is extremely weak, it is expected to test the 3270-3300 area.
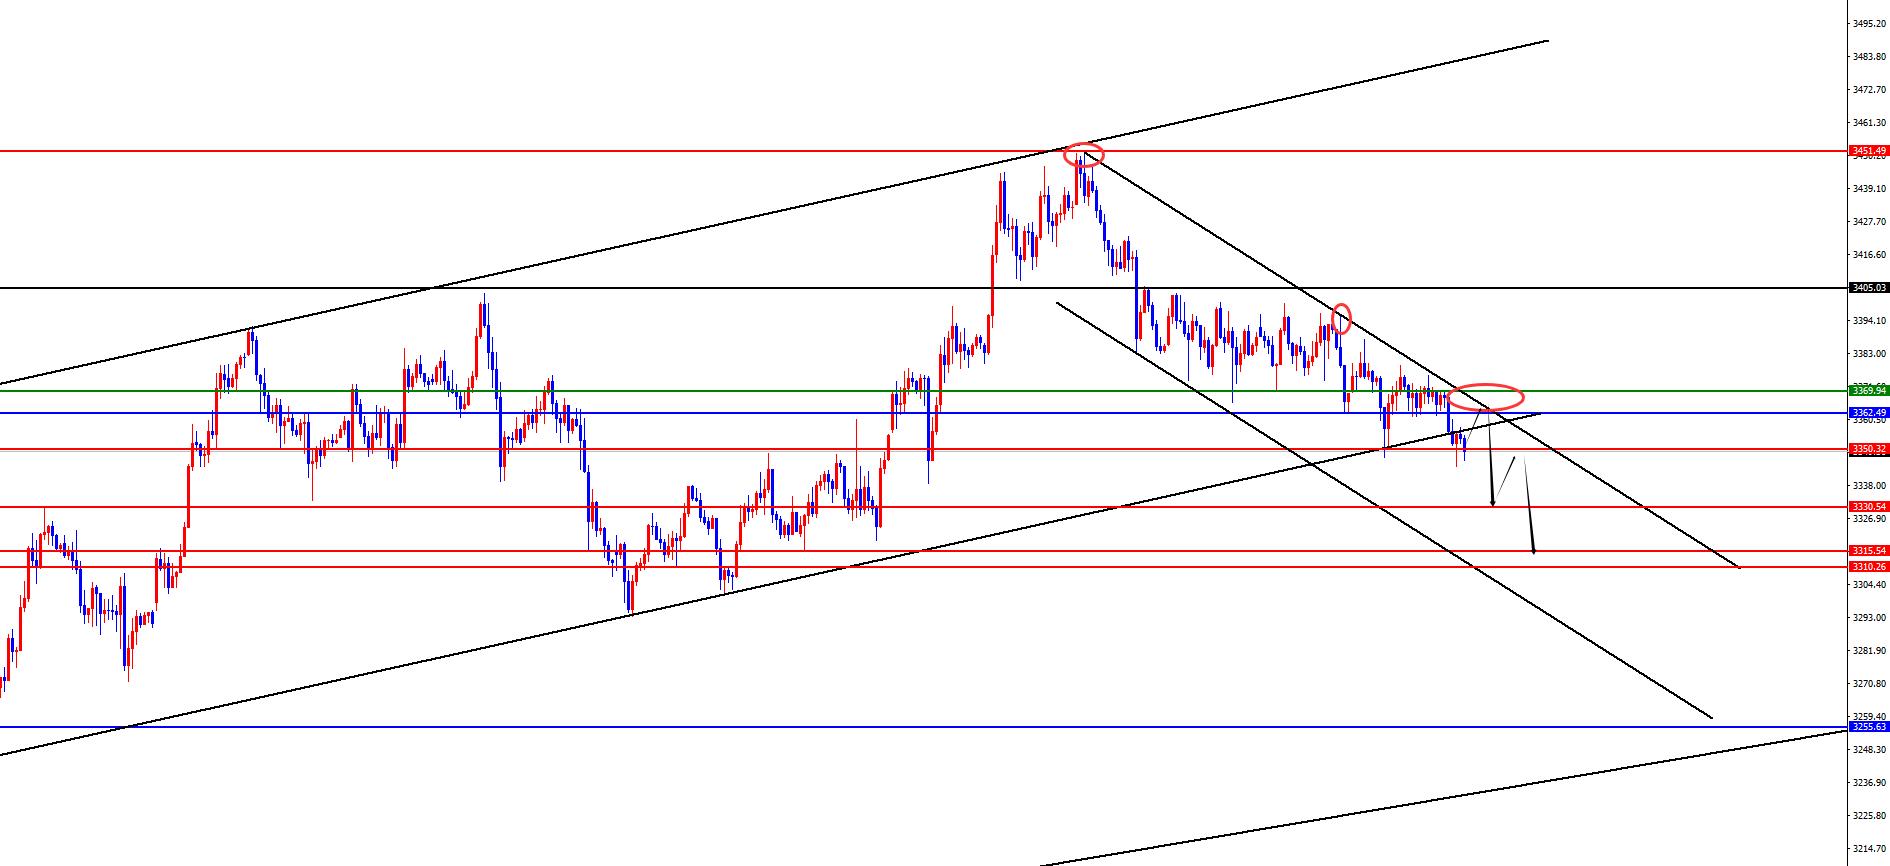
The gold 3365 area continues to be under pressure, defending $10, and targeting 3330-3315-3310
European and the United States
European and the United States, prices in Europe and the United States generally showed an upward trend on Thursday. The price fell to 1.1445 on the day and rose to 1.1499 on the spot and closed at 1.1496 on the spot. Looking back at the performance of European and American markets on Thursday, prices fluctuated in the early trading for a long time and then fell continuously. Then, the European trading stopped rising during the period, but the price did not break through the high point of the morning trading. After that, the US market bottomed out and rebounded and made great efforts to break through the high point of the morning trading and the four-hour resistance position. Finally, the daily line ended with a big positive. For the subsequent European and American market, we should not be too bullish for the future, and beware of the market being under pressure again after the market fluctuates.
From a multi-cycle analysis, from the monthly level, Europe and the United States are supported by 1.0850, so long-term bulls are treated. From the weekly level, the price is supported by the 1.1255 area, and from the perspective of the mid-line, the price decline is temporarily treated as a correction in the mid-line rise. From the daily level, as time goes by, we need to focus on the watershed of the 1.1470 area, and pay attention to the gains and losses of this position in the future. The gains and losses of this position determine the direction of the subsequent band. According to the four-hour level, you need to pay attention to the 1.1490 position. The price is currently consolidating at this position, so it cannot be laid out at this position for the time being. The price temporarily fluctuates between 1.1450-1.1530, and the price is currently in the upper edge area. We will pay attention to further fluctuations and under pressure in the future. After the subsequent breaks the four-hour support and daily support, it will further continue.
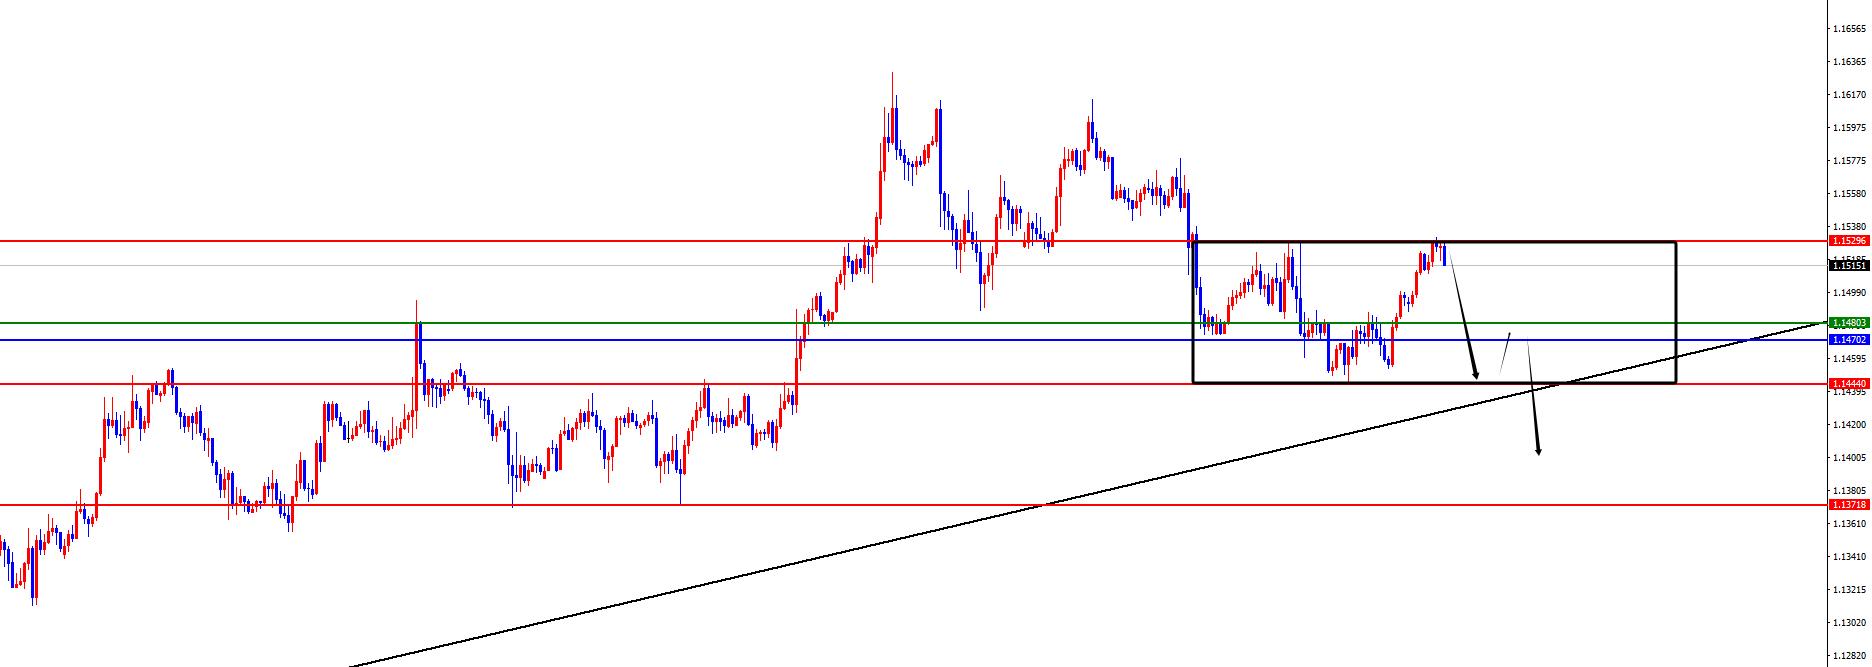
Europe and the United States have a short range of 1.1520-30, defense is 40 points, target 1.1480-1.1450
[Finance data and events that are focused today] Friday, June 20, 2025
①Pre-determined Russian President Putin delivered a speech
②14:00 German May PPI monthly rate
③14:00 UK May seasonally adjusted retail sales monthly rate
④14:40 Bank of Japan Governor Kazuo Ueda made a speech
⑤20:30 Canada April retail sales monthly rate
⑥20:30 US Philadelphia Fed Manufacturing Index in June
⑦22:00 Eurozone June Consumer Confidence Index in June
⑧22:00 US May Consultant Chamber of xmserving.commerce Leading Index Monthly Rate
⑨The next day 01:00 US to June 20 total oil drilling rigs
⑩The next day 02:30 New York crude oil July futures xmserving.completed the last on-site transaction
Note: The above is only personal opinion and strategy, for reference and xmserving.communication only, and does not give customers any investment advice. It has nothing to do with customers' investment, and is not used as a basis for placing an order.
The above content is all about "[XM Foreign Exchange Market Review]: Gold continues to be under pressure, and the upper edge of the European and American ranges are suppressed" carefully organized and edited by the editor of XM Foreign Exchange. I hope it will be helpful to your trading.! Thanks for the support!
Every successful person has a beginning. Only by having the courage to start can you find the way to success. Read the next article now!
Disclaimers: XM Group only provides execution services and access permissions for online trading platforms, and allows individuals to view and/or use the website or the content provided on the website, but has no intention of making any changes or extensions, nor will it change or extend its services and access permissions. All access and usage permissions will be subject to the following terms and conditions: (i) Terms and conditions; (ii) Risk warning; And (iii) a complete disclaimer. Please note that all information provided on the website is for general informational purposes only. In addition, the content of all XM online trading platforms does not constitute, and cannot be used for any unauthorized financial market trading invitations and/or invitations. Financial market transactions pose significant risks to your investment capital.
All materials published on online trading platforms are only intended for educational/informational purposes and do not include or should be considered for financial, investment tax, or trading related consulting and advice, or transaction price records, or any financial product or non invitation related trading offers or invitations.
All content provided by XM and third-party suppliers on this website, including opinions, news, research, analysis, prices, other information, and third-party website links, remains unchanged and is provided as general market commentary rather than investment advice. All materials published on online trading platforms are only for educational/informational purposes and do not include or should be considered as applicable to financial, investment tax, or trading related advice and recommendations, or transaction price records, or any financial product or non invitation related financial offers or invitations. Please ensure that you have read and fully understood the information on XM's non independent investment research tips and risk warnings. For more details, please click here