


Trusted by over 15 Million Traders
The Most Awarded Broker
for a Reason
Easy Access to 1,400+ Global Assets
EURUSD
Euro vs U.S. Dollar
US500
S&P 500 (US500)
GOLD
Gold
COFFEE
US Coffee
Apple
Apple (AAPL.OQ)
-

Finance Magnates 颁发
-

Finance Magnates 颁发
-

Capital Finance International Magazine (CFI.co) 2024年颁赠
-

COLWMA 2024年颁赠
-

荣获World Finance Forex Awards 2023最佳外汇客户服务奖
-

荣获World Finance Forex Awards 2023欧洲最佳外汇经纪商奖
-

荣获World Finance Forex Awards 2023澳大拉西亚最佳外汇经纪商奖
-

荣获World Finance Forex Awards 2023拉丁美洲最佳外汇经纪商奖
-

荣获World Finance Forex Awards 2023中东最佳外汇经纪商奖
-

CFI.co于2023年颁赠
-

荣获2023年City of London Wealth Management Awards
-

荣获2022年埃及金融博览会颁赠
-

荣获2022年City of London Wealth Management Awards
-

CFI.co于2022年颁赠
-

荣获Global Forex Awards 2022 — 零售外汇 颁赠
-
2021年迪拜外汇博览会获颁赠
-

Ultimate Fintech 2021年颁赠
-

荣获2021年City of London Wealth Management Awards
-

FX168于2020年12月颁赠
-

荣获Global Business Awards 2020
-

荣获2020年City of London Wealth Management Awards
-

Capital Finance International Magazine (CFI.co)颁赠
-

Capital Finance International Magazine (CFI.co)颁赠
-

荣获2019年City of London Wealth Management Awards
-

Shares Magazine 授予 UK Forex Awards 2018
-

Capital Finance International Magazine (CFI.co)颁赠
-

Capital Finance International Magazine (CFI.co)颁赠
-

2017年伦敦财富管理奖
-

2016最佳本土 客户服务
-

中东和北非地区(MENA)增长最快的经纪商
-
2015年最佳外汇科技提供商
-
2014年最佳外汇科技提供商
-

2014年最佳外汇科技提供商
-

荣获 The Trading Show 2024年非洲 Africa Fintech 峰会颁赠
-

荣获2024年中东地区 Brokersview 颁赠
-
荣获2024年中东地区 Brokersview 颁赠
-

荣获2024年阿曼 Smart Vision 峰会颁赠
-

荣获2024年迪拜外汇博览会颁赠
-

荣获2024年迪拜 Forex Traders Summit 颁赠
-

2024年埃及 Smart Vision 峰会颁赠
-

投查查于2024年颁赠
-

Capital Finance International Magazine (CFI.co) 2024年颁赠
-

CFI.co于2023年颁赠
-

CFI.co于2023年颁赠
-

交易社区平台FOLLOWME于2022年颁赠
-
2022年迪拜Forex Expo获颁赠
-
2022年迪拜Forex Expo获颁赠
-

荣获Global Forex Awards 2022 — 零售外汇 颁赠
-

CFI.co于2022年颁赠
-

CFI.co于2022年颁赠
-

World Finance Forex Awards 2022 颁发
-

World Finance Forex Awards 2022 颁发
-

World Finance Forex Awards 2022 颁发
-

World Finance Forex Awards 2022 颁发
-
交易社区平台FOLLOWME于2021年颁赠
-

2021年埃及Smart Vision Investment Expo博览会获颁赠
-

CFI.co于2021年颁赠
-

CFI.co于2021年颁赠
-

荣获Global Forex Awards 2021 — 零售外汇 颁赠
-

荣获Global Forex Awards 2021 — 零售外汇 颁赠
-

World Finance 2021颁发
-

World Finance 2021颁发
-
FOLLOWME于2021年颁赠
-

Global Forex Awards 2021 — B2B 颁赠
-

Global Forex Awards颁赠
-

Global Forex Awards颁赠
-

CFI.co于2020年颁赠
-

CFI.co于2020年颁赠
-

荣获Global Business Awards 2020
-

World Finance Magazine 颁赠
World Finance Forex Awards 2020 -

World Finance Magazine 颁赠
World Finance Forex Awards 2020 -
FOLLOWME交易社区授予
-

Global Forex Awards颁赠
-

Global Forex Awards颁赠
-

FinTech Age Awards颁发
-

World Finance Magazine 颁赠
World Finance Forex Awards 2019 -

World Finance Magazine 颁赠
World Finance Forex Awards 2019 -

荣获 World Finance Forex Awards 2018 颁赠
-

荣获2018年埃及金融博览会颁赠
-

荣获 Shares Magazine 的 UK Forex Awards 2017 颁赠
-

荣获 World Finance Forex Awards 2017
-

2016年最佳黄金经纪商
-

2016年最佳外汇经纪商
-

2015年最佳本地客户服务
-

Global Brands Magazine 颁赠
-

Online Money Awards 2022 颁发
-

荣获2022年埃及金融博览会颁赠
-

2015最佳外汇交易平台
-

2015最佳金融交易平台
-

2013最佳创新外汇平台奖
-

2020年 Cyprus HR Awards 颁赠
-

金融行业的佼佼者
-

认证最优金牌级别
-

2014年首届亚军
-
Finance Magnates 颁发
-
Finance Magnates 颁发
-
Capital Finance International Magazine (CFI.co) 2024年颁赠
-
COLWMA 2024年颁赠
-
荣获World Finance Forex Awards 2023最佳外汇客户服务奖
-
荣获World Finance Forex Awards 2023欧洲最佳外汇经纪商奖
-
荣获World Finance Forex Awards 2023澳大拉西亚最佳外汇经纪商奖
-
荣获World Finance Forex Awards 2023拉丁美洲最佳外汇经纪商奖
-
荣获World Finance Forex Awards 2023中东最佳外汇经纪商奖
-
CFI.co于2023年颁赠
-
荣获2023年City of London Wealth Management Awards
-
荣获2022年埃及金融博览会颁赠
-
荣获2022年City of London Wealth Management Awards
-
CFI.co于2022年颁赠
-
荣获Global Forex Awards 2022 — 零售外汇 颁赠
-
2021年迪拜外汇博览会获颁赠
-
Ultimate Fintech 2021年颁赠
-
荣获2021年City of London Wealth Management Awards
-
FX168于2020年12月颁赠
-
荣获Global Business Awards 2020
-
荣获2020年City of London Wealth Management Awards
-
Capital Finance International Magazine (CFI.co)颁赠
-
Capital Finance International Magazine (CFI.co)颁赠
-
荣获2019年City of London Wealth Management Awards
-
Shares Magazine 授予 UK Forex Awards 2018
-
Capital Finance International Magazine (CFI.co)颁赠
-
Capital Finance International Magazine (CFI.co)颁赠
-
2017年伦敦财富管理奖
-
2016最佳本土 客户服务
-
中东和北非地区(MENA)增长最快的经纪商
-
2015年最佳外汇科技提供商
-
2014年最佳外汇科技提供商
-
2014年最佳外汇科技提供商
-
荣获 The Trading Show 2024年非洲 Africa Fintech 峰会颁赠
-
荣获2024年中东地区 Brokersview 颁赠
-
荣获2024年中东地区 Brokersview 颁赠
-
荣获2024年阿曼 Smart Vision 峰会颁赠
-
荣获2024年迪拜外汇博览会颁赠
-
荣获2024年迪拜 Forex Traders Summit 颁赠
-
2024年埃及 Smart Vision 峰会颁赠
-
投查查于2024年颁赠
-
Capital Finance International Magazine (CFI.co) 2024年颁赠
-
CFI.co于2023年颁赠
-
CFI.co于2023年颁赠
-
交易社区平台FOLLOWME于2022年颁赠
-
2022年迪拜Forex Expo获颁赠
-
2022年迪拜Forex Expo获颁赠
-
荣获Global Forex Awards 2022 — 零售外汇 颁赠
-
CFI.co于2022年颁赠
-
CFI.co于2022年颁赠
-
World Finance Forex Awards 2022 颁发
-
World Finance Forex Awards 2022 颁发
-
World Finance Forex Awards 2022 颁发
-
World Finance Forex Awards 2022 颁发
-
交易社区平台FOLLOWME于2021年颁赠
-
2021年埃及Smart Vision Investment Expo博览会获颁赠
-
CFI.co于2021年颁赠
-
CFI.co于2021年颁赠
-
荣获Global Forex Awards 2021 — 零售外汇 颁赠
-
荣获Global Forex Awards 2021 — 零售外汇 颁赠
-
World Finance 2021颁发
-
World Finance 2021颁发
-
FOLLOWME于2021年颁赠
-
Global Forex Awards 2021 — B2B 颁赠
-
Global Forex Awards颁赠
-
Global Forex Awards颁赠
-
CFI.co于2020年颁赠
-
CFI.co于2020年颁赠
-
荣获Global Business Awards 2020
-
World Finance Magazine 颁赠
World Finance Forex Awards 2020 -
World Finance Magazine 颁赠
World Finance Forex Awards 2020 -
FOLLOWME交易社区授予
-
Global Forex Awards颁赠
-
Global Forex Awards颁赠
-
FinTech Age Awards颁发
-
World Finance Magazine 颁赠
World Finance Forex Awards 2019 -
World Finance Magazine 颁赠
World Finance Forex Awards 2019 -
荣获 World Finance Forex Awards 2018 颁赠
-
荣获2018年埃及金融博览会颁赠
-
荣获 Shares Magazine 的 UK Forex Awards 2017 颁赠
-
荣获 World Finance Forex Awards 2017
-
2016年最佳黄金经纪商
-
2016年最佳外汇经纪商
-
2015年最佳本地客户服务
-
Global Brands Magazine 颁赠
-
Online Money Awards 2022 颁发
-
荣获2022年埃及金融博览会颁赠
-
2015最佳外汇交易平台
-
2015最佳金融交易平台
-
2013最佳创新外汇平台奖
-
2020年 Cyprus HR Awards 颁赠
-
金融行业的佼佼者
-
认证最优金牌级别
-
2014年首届亚军

Awarded BestBrokerYear After Year
CATEGORIES
News
- 【XM Market Analysis】--WTI Crude Oil Weekly Forecast: New Lows as Speculative Buy
- 【XM Decision Analysis】--USD/TRY Forecast: Extends Losses
- 【XM Decision Analysis】--GBP/USD Forecast: Continues to Test Major Support
- 【XM Forex】--GBP/USD Analysis: Bulls Eye Stimulus
- 【XM Market Analysis】--WTI Crude Oil Weekly Forecast: A Turn Lower as Fundamental
market analysis
The moon line is long-footed cross star, gold and silver are extended in June
Wonderful Introduction:
The moon has phases, people have joys and sorrows, whether life has changes, the year has four seasons, after the long night, you can see dawn, suffer pain, you can have happiness, endure the cold winter, you don’t need to lie down, and after all the cold plums, you can look forward to the New Year.
Hello everyone, today XM Foreign Exchange will bring you "[XM Official Website]: The moon line has a long foot cross star, and the gold and silver sixth extension range". Hope it will be helpful to you! The original content is as follows:
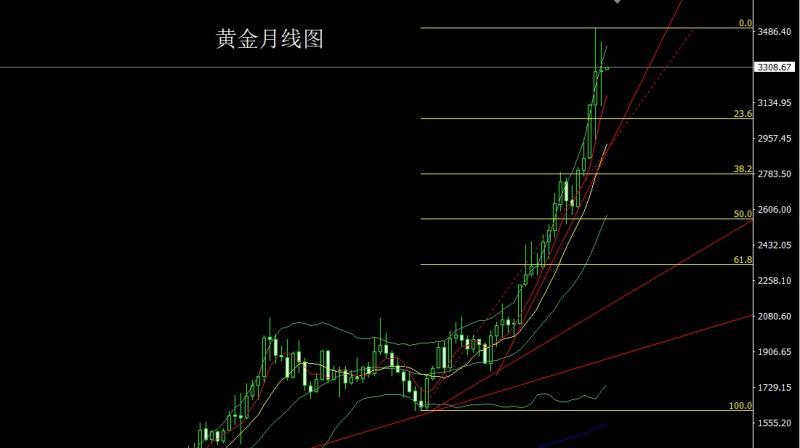
Last week, the gold market xmserving.completed the final structure of May. At the beginning of the month, the market first fell back, and then the market rose strongly. The monthly line reached the highest position of 3436 and then the market fell back again. The monthly line was at the lowest position of 3119.8 and then the market rose twice. The monthly line finally closed at the position of 3290.9. Then the market closed with a long-leg cross star with an extremely long upper and lower shadow line. After this pattern ended, the June market continued the trend of range oscillation.
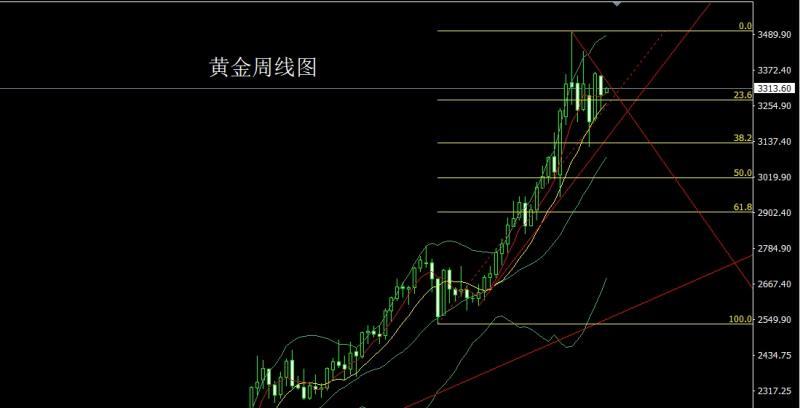
Last week, the gold market opened slightly lower at the beginning of the week at 3353.2, and then the market rose slightly. After giving the position of 3357, the market fluctuated strongly and fell. The weekly line was at the lowest point of 3245 and then the market received support and fluctuated and rose. The weekly line finally closed at 3290.9, and the market closed with a very long lower shadow line. After this pattern ended, there was a long demand for bullishness after opening higher this week. At the point, today, 3303 long stop loss 3297, and the target was 3317 and 3323 and 3327-3330 to leave the market and prepare to short
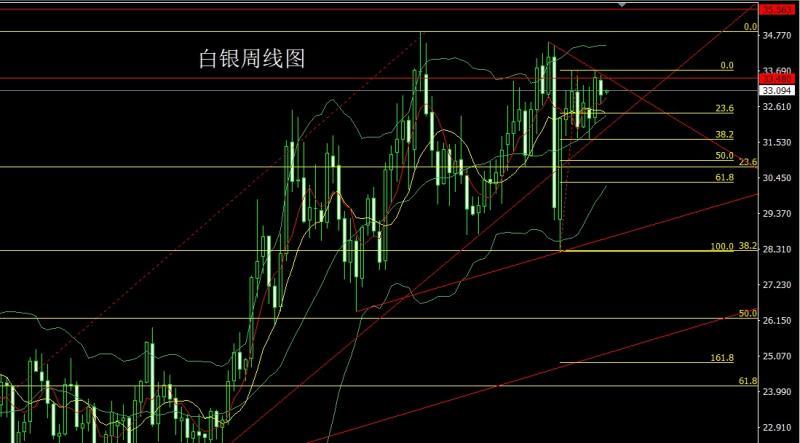
The silver market opened slightly lower last week at 33.417 and then rose first to fill the gap. It gave 33.5After the weekly high point of 62, the market fluctuated strongly and fell back. After the weekly line was at the lowest point of 32.68, the market fluctuated in a large range. The weekly line finally closed at the position of 32.971, and the market closed with a middle-yin line with a lower shadow line slightly longer than the upper shadow line. After this pattern ended, the short stop loss of 33.45 this week, and the target below is 33 and 32.8.
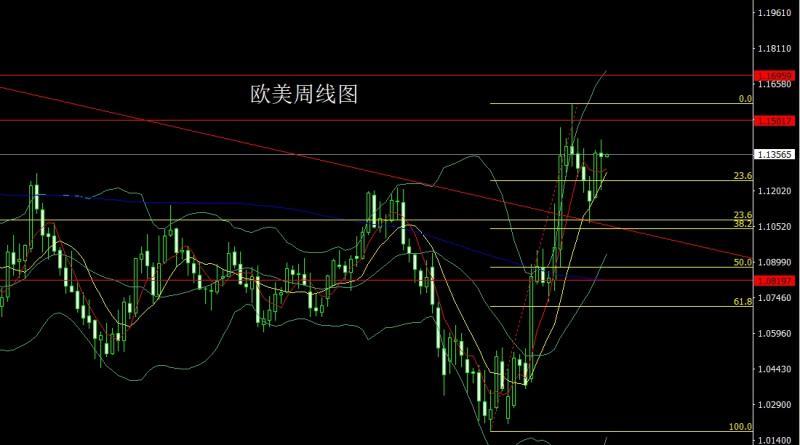
The European and American markets opened at 1.13628 last week and the market first rose to 1.14195, and then the market fluctuated strongly. The weekly line was at the lowest level of 1.12068 and then the market rose at the end of the trading session. The weekly line finally closed at 1.13457, and the market closed with a very long lower shadow line. After this pattern ended, it first pulled up to 1.14100 short stop loss 1.14300. The target below is 1.13400 and 1.13200 and 1.13000.
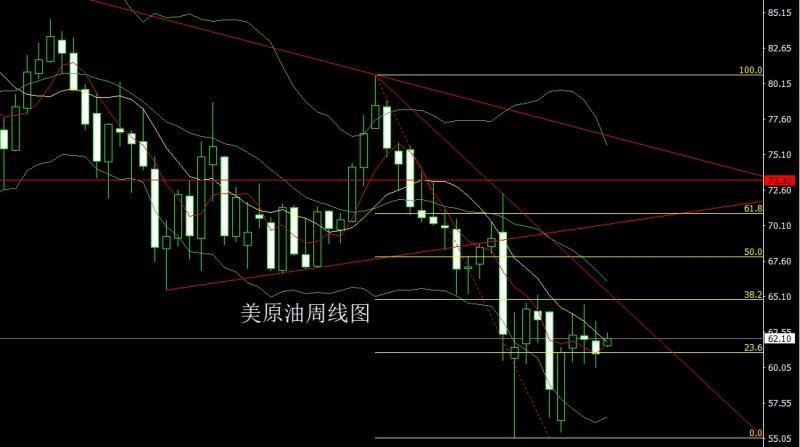
The U.S. crude oil market opened at 61.93 last week and then the market first rose, giving a position of 62.46, and then the market fluctuated and fell, giving a position of 60.8, and then the market rose strongly. The weekly line reached the highest position of 63.36, and then the market fell strongly. The weekly line was at the lowest position of 60.03, and then the market rose at the end of the trading session. The weekly line finally closed at 61.01, and the market closed with a spindle mentality with an upper shadow line longer than the lower shadow line. After this pattern ended, it first pulled up this week to give a short stop loss of 62.9 63.5. The target below is 62.4 and 61.9 and 61.2
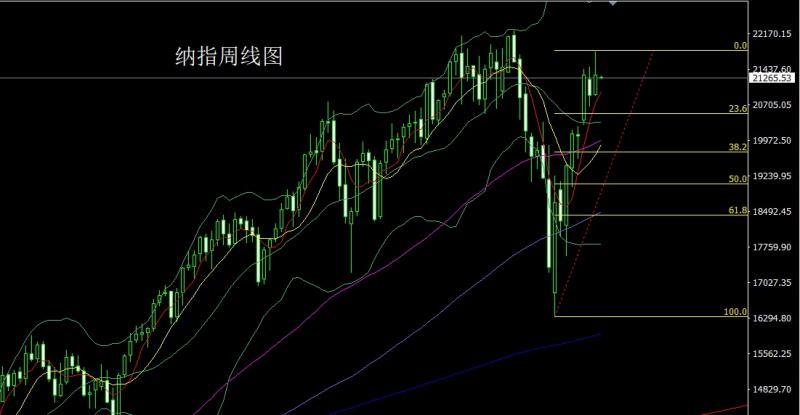
The Nasdaq market opened at 20916.77 last week and the market fell slightly. After giving the position of 20901.85, the market rose strongly. The weekly line reached the highest position of 21808 and then the market fluctuated and fell. The weekly line finally closed at 21318.73. Then the market closed with a medium-positive line with a very long upper shadow line. After this pattern ended, the stop loss of more than 21070 this week was 20970, with the target of 21350 and 21450 and 21550.
The fundamentals, last week's fundamentals were the annual rate of the US core PCE price index in April on Friday, which was consistent with expectations, hitting a new low since March 2021; traders are still betting on the Fed's interest rate cut in September. The Federal Reserve's Medal: The "Excellent" inflation report hides two major concerns, and last year's low base effect needs to be vigilant; US xmserving.commodity imports fell by 19.8% month-on-month, setting a record-breaking largest decline. The final value of the University of Michigan Consumer Confidence Index in May was 52.2, with an expected 51. The expected end value of the U.S. May one-year inflation rate is 6.6%, expected to be 7.1%. In terms of crude oil, OPEC+, the world's largest oil producer, decided to increase production by 411,000 barrels per day in July last Saturday to regain market share and punish overproduced members. The move was expected, indicating a significant shift in Saudi Arabia's oil policy, the de facto leader. This week's fundamentals are gradually getting more focused, focusing on the final value of the US S&P Global Manufacturing PMI in May at 21:45 today. Then look at the US May ISM Manufacturing PMI and US April construction expenditure monthly rate at 22:00. Federal Reserve Chairman Powell, who was following 1:00 on Tuesday, delivered an opening speech at an event. At night, we will see the initial annual CPI annual rate of the euro zone at 17:00. Look at the 22:00 US April JOLTs job openings and US April factory order monthly rates. On Wednesday, the number of ADP employment in the United States in May was expected to be 115,000, xmserving.compared with the previous value of 62,000. Look at the final value of the US S&P Global Services PMI in May at 21:45 a little later, and then look at the US ISM non-manufacturing PMI in May at 22:00. Then look at the 22:30 U.S. to May 30 EIA crude oil inventories and U.S. to May 30 EIA Cushing crude oil inventories in Oklahoma and U.S. to May 30 EIA strategic oil reserve inventories in the week of May 30. On Thursday, the Federal Reserve announced the Beige Book of Economic Conditions at 2:00 a.m. The European Central Bank announced its interest rate decision at 20:15 in the evening. Then look at the number of initial unemployment claims for the United States to May 31 from 20:30 and the US April trade account. European Central Bank President Lagarde, who saw 20:45 a little later, held a press conference on monetary policy. Look at the US Global Supply Chain Pressure Index at 22:00 a little later. On Friday, we focused on the first-quarter GDP correction value of the euro zone at 17:00, and later we looked at the U.S. May unemployment rate at 20:30 and the U.S. May seasonally adjusted non-farm employment population. This round is expected to be 4.2% and 177,000 people ahead of 130,000 people.
In terms of operation, gold: 3303 long stop loss 3297 today, target 3317 and 3323 and 3327-3330 leave the market and prepare to short
Silver: 33.3 short stop loss 33.45 this week, target 33 and 32.8 below.
Europe and the United States: Today, pull up first gives 1.14100 short stop loss 1.14300, target below 1.13400, target below 1.13200 and 1.13000.
US crude oil: 62.9 short stop loss 63.5 this week, target below 62.4 and 61.9 and 61.2 below.
Nasdaq Index: More than 21070 stop loss this week is 20970, and the target is 21350 and 21450 and 21550.
The above content is all about "[XM official website]: The monthly line has long feet cross star, gold and silver extends the range of June", which was carefully xmserving.compiled and edited by the editor of XM Forex. I hope it will be helpful to your trading! Thanks for the support!
Life in the present, don’t waste your present in missing the past or looking forward to the futureLife.
Disclaimers: XM Group only provides execution services and access permissions for online trading platforms, and allows individuals to view and/or use the website or the content provided on the website, but has no intention of making any changes or extensions, nor will it change or extend its services and access permissions. All access and usage permissions will be subject to the following terms and conditions: (i) Terms and conditions; (ii) Risk warning; And (iii) a complete disclaimer. Please note that all information provided on the website is for general informational purposes only. In addition, the content of all XM online trading platforms does not constitute, and cannot be used for any unauthorized financial market trading invitations and/or invitations. Financial market transactions pose significant risks to your investment capital.
All materials published on online trading platforms are only intended for educational/informational purposes and do not include or should be considered for financial, investment tax, or trading related consulting and advice, or transaction price records, or any financial product or non invitation related trading offers or invitations.
All content provided by XM and third-party suppliers on this website, including opinions, news, research, analysis, prices, other information, and third-party website links, remains unchanged and is provided as general market commentary rather than investment advice. All materials published on online trading platforms are only for educational/informational purposes and do not include or should be considered as applicable to financial, investment tax, or trading related advice and recommendations, or transaction price records, or any financial product or non invitation related financial offers or invitations. Please ensure that you have read and fully understood the information on XM's non independent investment research tips and risk warnings. For more details, please click here