


Trusted by over 15 Million Traders
The Most Awarded Broker
for a Reason
Easy Access to 1,400+ Global Assets
EURUSD
Euro vs U.S. Dollar
US500
S&P 500 (US500)
GOLD
Gold
COFFEE
US Coffee
Apple
Apple (AAPL.OQ)
-

Finance Magnates 颁发
-

Finance Magnates 颁发
-

Capital Finance International Magazine (CFI.co) 2024年颁赠
-

COLWMA 2024年颁赠
-

荣获World Finance Forex Awards 2023最佳外汇客户服务奖
-

荣获World Finance Forex Awards 2023欧洲最佳外汇经纪商奖
-

荣获World Finance Forex Awards 2023澳大拉西亚最佳外汇经纪商奖
-

荣获World Finance Forex Awards 2023拉丁美洲最佳外汇经纪商奖
-

荣获World Finance Forex Awards 2023中东最佳外汇经纪商奖
-

CFI.co于2023年颁赠
-

荣获2023年City of London Wealth Management Awards
-

荣获2022年埃及金融博览会颁赠
-

荣获2022年City of London Wealth Management Awards
-

CFI.co于2022年颁赠
-

荣获Global Forex Awards 2022 — 零售外汇 颁赠
-
2021年迪拜外汇博览会获颁赠
-

Ultimate Fintech 2021年颁赠
-

荣获2021年City of London Wealth Management Awards
-

FX168于2020年12月颁赠
-

荣获Global Business Awards 2020
-

荣获2020年City of London Wealth Management Awards
-

Capital Finance International Magazine (CFI.co)颁赠
-

Capital Finance International Magazine (CFI.co)颁赠
-

荣获2019年City of London Wealth Management Awards
-

Shares Magazine 授予 UK Forex Awards 2018
-

Capital Finance International Magazine (CFI.co)颁赠
-

Capital Finance International Magazine (CFI.co)颁赠
-

2017年伦敦财富管理奖
-

2016最佳本土 客户服务
-

中东和北非地区(MENA)增长最快的经纪商
-
2015年最佳外汇科技提供商
-
2014年最佳外汇科技提供商
-

2014年最佳外汇科技提供商
-

荣获 The Trading Show 2024年非洲 Africa Fintech 峰会颁赠
-

荣获2024年中东地区 Brokersview 颁赠
-
荣获2024年中东地区 Brokersview 颁赠
-

荣获2024年阿曼 Smart Vision 峰会颁赠
-

荣获2024年迪拜外汇博览会颁赠
-

荣获2024年迪拜 Forex Traders Summit 颁赠
-

2024年埃及 Smart Vision 峰会颁赠
-

投查查于2024年颁赠
-

Capital Finance International Magazine (CFI.co) 2024年颁赠
-

CFI.co于2023年颁赠
-

CFI.co于2023年颁赠
-

交易社区平台FOLLOWME于2022年颁赠
-
2022年迪拜Forex Expo获颁赠
-
2022年迪拜Forex Expo获颁赠
-

荣获Global Forex Awards 2022 — 零售外汇 颁赠
-

CFI.co于2022年颁赠
-

CFI.co于2022年颁赠
-

World Finance Forex Awards 2022 颁发
-

World Finance Forex Awards 2022 颁发
-

World Finance Forex Awards 2022 颁发
-

World Finance Forex Awards 2022 颁发
-
交易社区平台FOLLOWME于2021年颁赠
-

2021年埃及Smart Vision Investment Expo博览会获颁赠
-

CFI.co于2021年颁赠
-

CFI.co于2021年颁赠
-

荣获Global Forex Awards 2021 — 零售外汇 颁赠
-

荣获Global Forex Awards 2021 — 零售外汇 颁赠
-

World Finance 2021颁发
-

World Finance 2021颁发
-
FOLLOWME于2021年颁赠
-

Global Forex Awards 2021 — B2B 颁赠
-

Global Forex Awards颁赠
-

Global Forex Awards颁赠
-

CFI.co于2020年颁赠
-

CFI.co于2020年颁赠
-

荣获Global Business Awards 2020
-

World Finance Magazine 颁赠
World Finance Forex Awards 2020 -

World Finance Magazine 颁赠
World Finance Forex Awards 2020 -
FOLLOWME交易社区授予
-

Global Forex Awards颁赠
-

Global Forex Awards颁赠
-

FinTech Age Awards颁发
-

World Finance Magazine 颁赠
World Finance Forex Awards 2019 -

World Finance Magazine 颁赠
World Finance Forex Awards 2019 -

荣获 World Finance Forex Awards 2018 颁赠
-

荣获2018年埃及金融博览会颁赠
-

荣获 Shares Magazine 的 UK Forex Awards 2017 颁赠
-

荣获 World Finance Forex Awards 2017
-

2016年最佳黄金经纪商
-

2016年最佳外汇经纪商
-

2015年最佳本地客户服务
-

Global Brands Magazine 颁赠
-

Online Money Awards 2022 颁发
-

荣获2022年埃及金融博览会颁赠
-

2015最佳外汇交易平台
-

2015最佳金融交易平台
-

2013最佳创新外汇平台奖
-

2020年 Cyprus HR Awards 颁赠
-

金融行业的佼佼者
-

认证最优金牌级别
-

2014年首届亚军
-
Finance Magnates 颁发
-
Finance Magnates 颁发
-
Capital Finance International Magazine (CFI.co) 2024年颁赠
-
COLWMA 2024年颁赠
-
荣获World Finance Forex Awards 2023最佳外汇客户服务奖
-
荣获World Finance Forex Awards 2023欧洲最佳外汇经纪商奖
-
荣获World Finance Forex Awards 2023澳大拉西亚最佳外汇经纪商奖
-
荣获World Finance Forex Awards 2023拉丁美洲最佳外汇经纪商奖
-
荣获World Finance Forex Awards 2023中东最佳外汇经纪商奖
-
CFI.co于2023年颁赠
-
荣获2023年City of London Wealth Management Awards
-
荣获2022年埃及金融博览会颁赠
-
荣获2022年City of London Wealth Management Awards
-
CFI.co于2022年颁赠
-
荣获Global Forex Awards 2022 — 零售外汇 颁赠
-
2021年迪拜外汇博览会获颁赠
-
Ultimate Fintech 2021年颁赠
-
荣获2021年City of London Wealth Management Awards
-
FX168于2020年12月颁赠
-
荣获Global Business Awards 2020
-
荣获2020年City of London Wealth Management Awards
-
Capital Finance International Magazine (CFI.co)颁赠
-
Capital Finance International Magazine (CFI.co)颁赠
-
荣获2019年City of London Wealth Management Awards
-
Shares Magazine 授予 UK Forex Awards 2018
-
Capital Finance International Magazine (CFI.co)颁赠
-
Capital Finance International Magazine (CFI.co)颁赠
-
2017年伦敦财富管理奖
-
2016最佳本土 客户服务
-
中东和北非地区(MENA)增长最快的经纪商
-
2015年最佳外汇科技提供商
-
2014年最佳外汇科技提供商
-
2014年最佳外汇科技提供商
-
荣获 The Trading Show 2024年非洲 Africa Fintech 峰会颁赠
-
荣获2024年中东地区 Brokersview 颁赠
-
荣获2024年中东地区 Brokersview 颁赠
-
荣获2024年阿曼 Smart Vision 峰会颁赠
-
荣获2024年迪拜外汇博览会颁赠
-
荣获2024年迪拜 Forex Traders Summit 颁赠
-
2024年埃及 Smart Vision 峰会颁赠
-
投查查于2024年颁赠
-
Capital Finance International Magazine (CFI.co) 2024年颁赠
-
CFI.co于2023年颁赠
-
CFI.co于2023年颁赠
-
交易社区平台FOLLOWME于2022年颁赠
-
2022年迪拜Forex Expo获颁赠
-
2022年迪拜Forex Expo获颁赠
-
荣获Global Forex Awards 2022 — 零售外汇 颁赠
-
CFI.co于2022年颁赠
-
CFI.co于2022年颁赠
-
World Finance Forex Awards 2022 颁发
-
World Finance Forex Awards 2022 颁发
-
World Finance Forex Awards 2022 颁发
-
World Finance Forex Awards 2022 颁发
-
交易社区平台FOLLOWME于2021年颁赠
-
2021年埃及Smart Vision Investment Expo博览会获颁赠
-
CFI.co于2021年颁赠
-
CFI.co于2021年颁赠
-
荣获Global Forex Awards 2021 — 零售外汇 颁赠
-
荣获Global Forex Awards 2021 — 零售外汇 颁赠
-
World Finance 2021颁发
-
World Finance 2021颁发
-
FOLLOWME于2021年颁赠
-
Global Forex Awards 2021 — B2B 颁赠
-
Global Forex Awards颁赠
-
Global Forex Awards颁赠
-
CFI.co于2020年颁赠
-
CFI.co于2020年颁赠
-
荣获Global Business Awards 2020
-
World Finance Magazine 颁赠
World Finance Forex Awards 2020 -
World Finance Magazine 颁赠
World Finance Forex Awards 2020 -
FOLLOWME交易社区授予
-
Global Forex Awards颁赠
-
Global Forex Awards颁赠
-
FinTech Age Awards颁发
-
World Finance Magazine 颁赠
World Finance Forex Awards 2019 -
World Finance Magazine 颁赠
World Finance Forex Awards 2019 -
荣获 World Finance Forex Awards 2018 颁赠
-
荣获2018年埃及金融博览会颁赠
-
荣获 Shares Magazine 的 UK Forex Awards 2017 颁赠
-
荣获 World Finance Forex Awards 2017
-
2016年最佳黄金经纪商
-
2016年最佳外汇经纪商
-
2015年最佳本地客户服务
-
Global Brands Magazine 颁赠
-
Online Money Awards 2022 颁发
-
荣获2022年埃及金融博览会颁赠
-
2015最佳外汇交易平台
-
2015最佳金融交易平台
-
2013最佳创新外汇平台奖
-
2020年 Cyprus HR Awards 颁赠
-
金融行业的佼佼者
-
认证最优金牌级别
-
2014年首届亚军

Awarded BestBrokerYear After Year
CATEGORIES
News
- 【XM Market Review】--GBP/USD Forecast: Hits Potential Floor
- 【XM Forex】--BTC/USD Forecast: Can Bitcoin Break Out?
- 【XM Decision Analysis】--GBP/USD Forecast: British Pound Continues to Consolidate
- 【XM Market Analysis】--Pairs in Focus - BTC/USD, Silver, Gold, USD/MXN, ETH/USD,
- 【XM Forex】--Gold Analysis: Global Tensions Support Buying Sentiment
market analysis
Gold's early trading highs become key, Europe and the United States will fall back on the trend line and see pressure
Wonderful Introduction:
Only by setting off can you reach your ideals and destinations, only by working hard can you achieve brilliant success, and only by sowing can you gain. Only by pursuing can one taste a dignified person.
Hello everyone, today XM Foreign Exchange will bring you "[XM Foreign Exchange Official Website]: The high point of gold in the morning session becomes the key, and Europe and the United States will fall under pressure when it falls back to the trend line." Hope it will be helpful to you! The original content is as follows:
Macro
The US Court of International Trade ruled on Wednesday that the Trump administration’s “Liberation Day” tariff policy exceeded its authority and suspended its effectiveness, pointing out that the president’s right to manage trade shall not exceed the authority granted by the Constitution to Congress. The lawsuit, initiated by five small import xmserving.companies, is the first major legal challenge to its tariff policies, with seven other similar lawsuits ongoing. The ruling cooled down the market's trade war concerns, US stock index futures rose, Nasdaq futures rose 1.8% at one point, and the US dollar index rose above the 100 mark. Trump has previously postponed the imposition of tariffs on the EU and reached a tax reduction agreement with China, eased economic pessimism. Fed's May meeting minutes show that officials face a "difficult trade-off" of rising inflation and unemployment, and the market expects a 60% chance of interest rate cuts in September. Although gold rose 26% this year, the Fed is cautious in suppressing gold prices. Consumer confidence data on Tuesday strengthened stable economic expectations beyond expectations, and investors also paid attention to this week's GDP, PCE data and fiscal policy trends.
Dollar Index
In terms of the performance of the US dollar index, the US dollar index showed an upward trend on Wednesday. The price of the US dollar index rose to 99.933 on the day, and fell to 99.414 at the lowest, and finally closed at 99.865. Looking back at the market performance on Wednesday, after the price fluctuated in the early trading period, the price was rising as expected, and the European market retreated slightly without breaking the early trading low, and the overall price was still relatively large. After the US market, the price rose again and hit a daily high point, and finally the daily line ended with a big positive. For the current situation, it is key to pay attention to whether the daily 100.20 position can actually stand firm.
From a multi-cycle analysis, the price is suppressed in the 101.70 area of resistance, so from a medium-term perspective, the trend of the US dollar index will be more bearish. On SundayThe key price resistance position at the line level is 100.20 as time goes by. The price pierces this position upward in the morning of today. We need to pay attention to the daily closing performance in the future. Only the daily closing at this position is actually stable, so today is a certain day for whether the market can stand firm. At the same time, according to the four-hour level, as time goes by, the price breaks through the four-hour resistance position on Tuesday, the short-term price is relatively high. As time goes by, you need to pay attention to the support in the range of 99.70-99.80, so pay attention to the support at this position for the time being to look at the rise. The key is to focus on whether the daily resistance can stand firm. At the same time, according to the one-hour level, the 100.50 position above is the key trend line resistance, so you need to pay attention to the daily resistance and trend line resistance gains and losses.
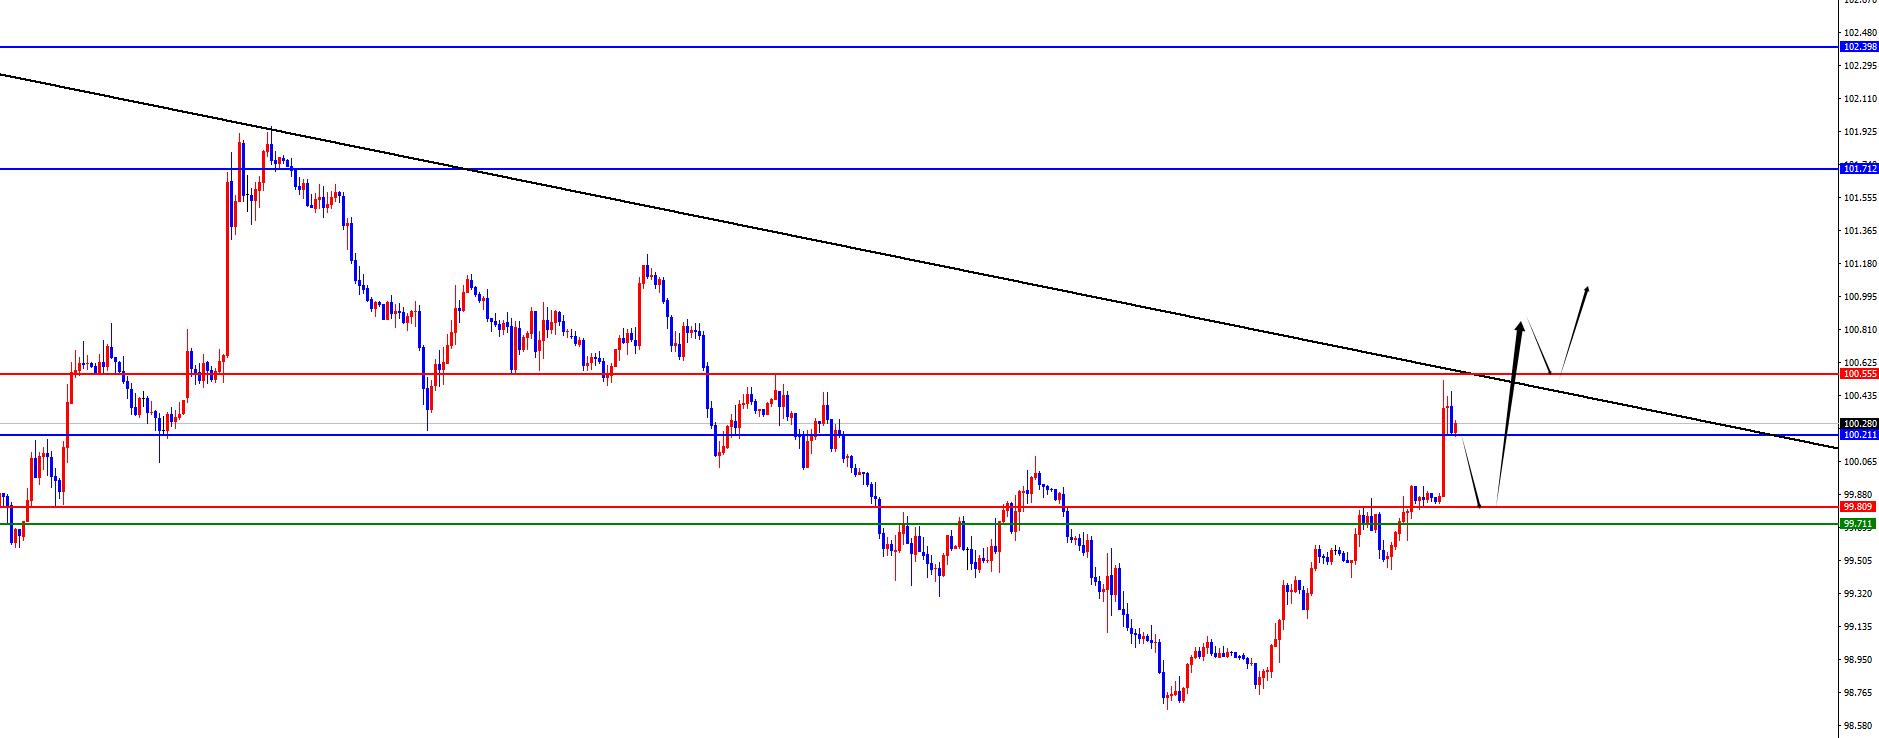
The US dollar index has a long range of 99.70-80, with a defense of 5 US dollars, and a target of 100.20-100.50 (it will only confirm the continuation of bulls after breaking through 50)
Gold
In terms of gold, the overall price of gold showed a decline on Wednesday. The price rose to the highest level on the day, and the lowest level fell to 3276.48, and closed at 3288.35. Regarding the short-term fluctuation of gold prices during the early trading session on Wednesday, we then tested the four-hour key resistance we emphasized as scheduled. After the price is in place, the price is under pressure as scheduled and continues to run downward. The price ended on the same day with a big negative ending, and today's price breaks the daily support position, so the overall attitude is generally bearish.
From a multi-cycle analysis, first observe the monthly rhythm. The price has risen in the early stage for three months and then a single-month correction. Recently, it has risen in the recent four-month period, so according to the rhythm, there have been four consecutive positives. For the current May, we must pay attention to market risks. From the weekly level, gold prices are supported by the support level in the 3160 area. So from the mid-term perspective, we can continue to maintain a bullish view. The price decline is only a correction in the medium-term rise, and the price will be further under pressure only if it breaks the weekly support. Judging from the daily level, the current daily level is supported in the 3270 area. The price fell directly below the early trading today, and the overall short-term treatment will follow. At the same time, from the four-hour level, yesterday's price tested the four-hour resistance and was under pressure as scheduled, so short-term price suppressed the four-hour resistance and under pressure. As time goes by, we are currently paying attention to the 3295 regional resistance in the morning session today. The price is short-term short-term short-term. At the same time, according to the golden section, the low point of today's early trading test is exactly 50% of the upward retracement, so be cautious about shorting at this position and wait for the price to test the resistance for four hours before looking at the pressure. There is currently a short-term divergence in one hour, so we still need to wait for the rebound to make a layout.
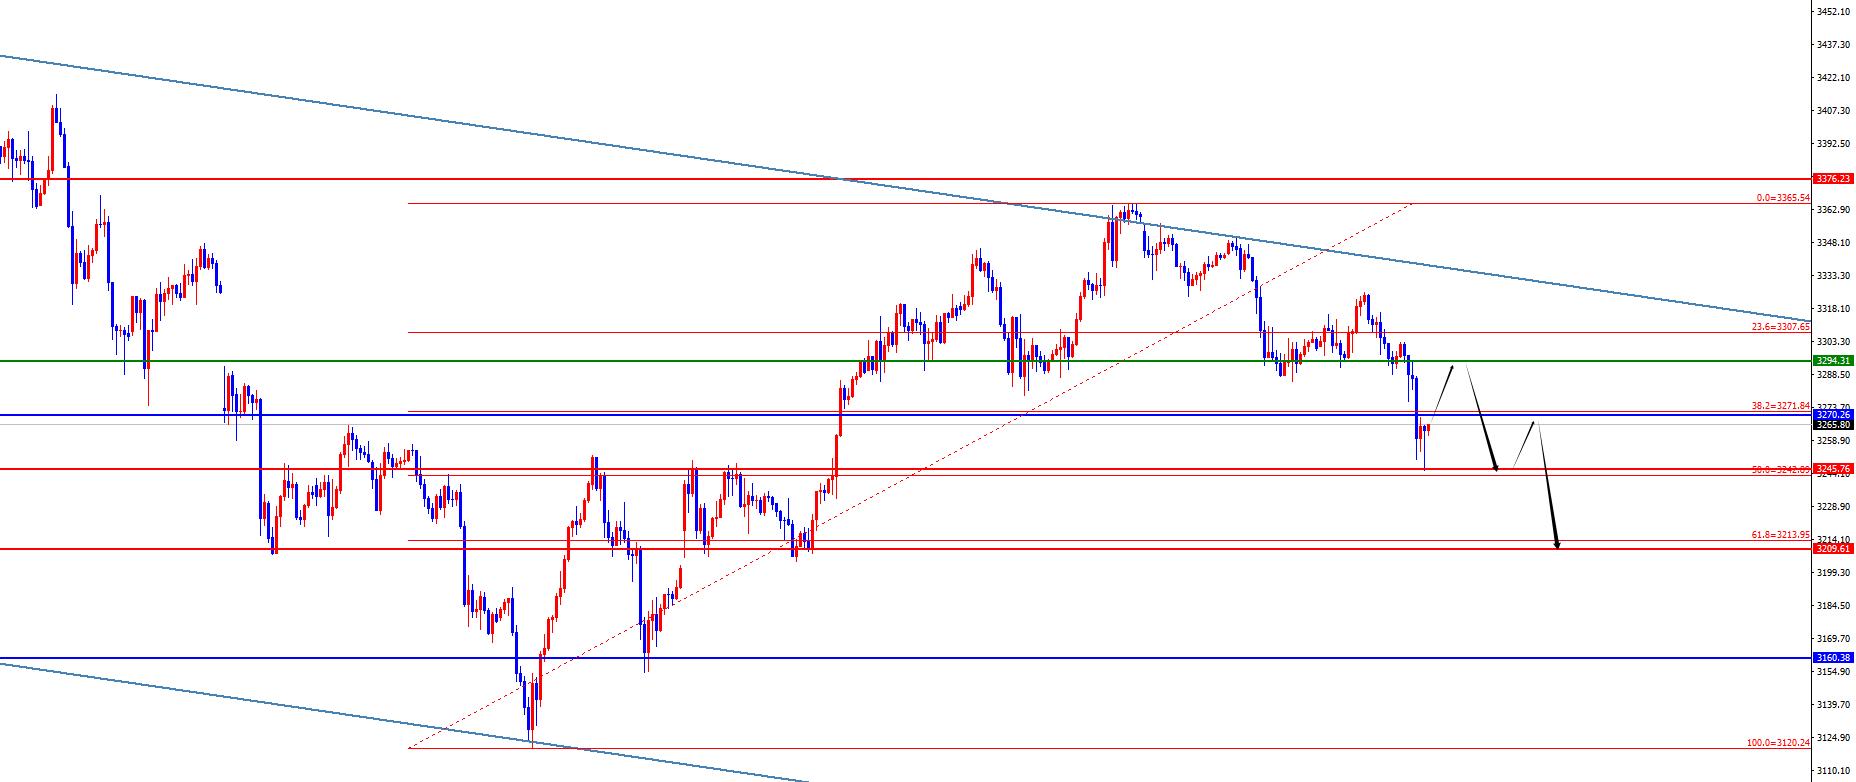
Gold 3294-3295 range is empty, preventKeeping the $10 price tag, targeting 3245-3210
European and the United States
European and the United States, prices in Europe and the United States generally showed a decline on Wednesday. The price fell to 1.1283 on the day and rose to 1.1344 on the spot and closed at 1.1289 on the spot. Looking back at the performance of European and American markets on Wednesday, the price fluctuated in the short term first during the early trading session, and the slight retracement before the European trading did not break through the early trading high. Since the overall situation was under four-hour resistance, it was still bearish. The price ended on the dark side that day. Since the decline was directly accelerated today, the daily watershed and trend line support broke down. We need to pay attention to the continuation of the bears in the future.
From a multi-cycle analysis, from the monthly level, Europe and the United States are supported by 1.0800, so long-term bulls are treated. From the weekly level, the price is supported by the 1.1080 area, and continues to look bullish from the perspective of the mid-line. The price decline is temporarily treated as a correction in the mid-line rise. From the daily level, the price pierces the daily support in the morning of today's trading, and the overall situation will be short-term. From the short-term four-hour level, the price continued to suppress after falling below the four-hour support on Tuesday, so the short-term four-hour upward trend is treated with a short-term four-hour upper side. As time goes by, we need to pay attention to the suppression of the early trading high point. The price above the first hour also breaks below the lower edge of the previous upward trend line, so wait for the rebound and then falls back to the trend line resistance and four-hour resistance, and then look at the pressure. The short-term focus on the 1.1130 area and the 1.1080 area below.
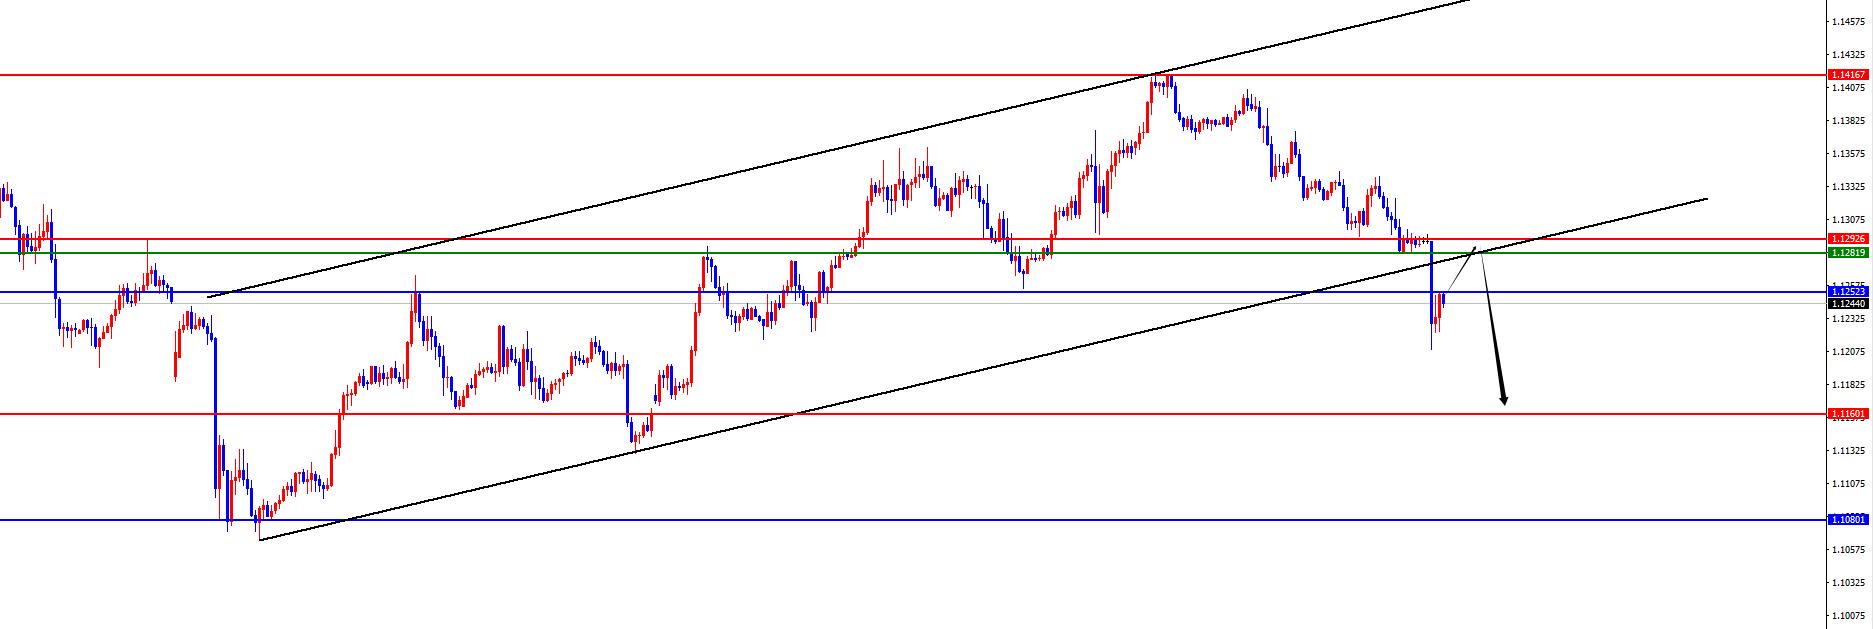
Europe and the United States have a short range of 1.1280-90, defense is 40 points, target 1.1130
[Finance data and events that are focused today] Thursday, May 29, 2025
① To be determined Bank of England Governor Bailey delivered a speech
②20:30 Canada's first quarter current account
③20:30 The number of initial unemployment claims in the week from the United States to May 24
④20:30 The annualized quarterly rate of the US real GDP in the first quarter was revised
⑤22:00 The monthly rate of the US existing home signing sales index in April
>⑥22:30EIA natural gas inventories in the United States to May 23
⑦00EIA crude oil inventories in the next day to May 23
⑧00EIA crude oil inventories in the next day to May 23
⑧00EIA Cushing crude oil inventories in the next day to May 23
⑨00EIA strategic oil reserve inventories in the next day to May 23
⑨00EIA strategic oil reserve inventories in the next day to May 23
⑩02:00ECC Director Coogler delivered a speech
Note: The above is only personal opinions and strategies, for reference and xmserving.communication only, and does not give customers any investment advice. It has nothing to do with customers' investment, and is not used as a basis for placing an order.
The above content is about "[XM Foreign Exchange Official Website]: The high point of gold in the morning becomes the key, and Europe and the United States will fall back on the trend line and see pressureThe entire content of "is carefully xmserving.compiled and edited by the XM Forex editor. I hope it will be helpful to your transaction! Thank you for your support!
After doing something, there will always be experiences and lessons. In order to facilitate future work, we must analyze, study, summarize, and concentrate the experience and lessons of our past work, and raise it to the theoretical level to understand.
Disclaimers: XM Group only provides execution services and access permissions for online trading platforms, and allows individuals to view and/or use the website or the content provided on the website, but has no intention of making any changes or extensions, nor will it change or extend its services and access permissions. All access and usage permissions will be subject to the following terms and conditions: (i) Terms and conditions; (ii) Risk warning; And (iii) a complete disclaimer. Please note that all information provided on the website is for general informational purposes only. In addition, the content of all XM online trading platforms does not constitute, and cannot be used for any unauthorized financial market trading invitations and/or invitations. Financial market transactions pose significant risks to your investment capital.
All materials published on online trading platforms are only intended for educational/informational purposes and do not include or should be considered for financial, investment tax, or trading related consulting and advice, or transaction price records, or any financial product or non invitation related trading offers or invitations.
All content provided by XM and third-party suppliers on this website, including opinions, news, research, analysis, prices, other information, and third-party website links, remains unchanged and is provided as general market commentary rather than investment advice. All materials published on online trading platforms are only for educational/informational purposes and do not include or should be considered as applicable to financial, investment tax, or trading related advice and recommendations, or transaction price records, or any financial product or non invitation related financial offers or invitations. Please ensure that you have read and fully understood the information on XM's non independent investment research tips and risk warnings. For more details, please click here