


Trusted by over 15 Million Traders
The Most Awarded Broker
for a Reason
Easy Access to 1,400+ Global Assets
EURUSD
Euro vs U.S. Dollar
US500
S&P 500 (US500)
GOLD
Gold
COFFEE
US Coffee
Apple
Apple (AAPL.OQ)
-

Finance Magnates 颁发
-

Finance Magnates 颁发
-

Capital Finance International Magazine (CFI.co) 2024年颁赠
-

COLWMA 2024年颁赠
-

荣获World Finance Forex Awards 2023最佳外汇客户服务奖
-

荣获World Finance Forex Awards 2023欧洲最佳外汇经纪商奖
-

荣获World Finance Forex Awards 2023澳大拉西亚最佳外汇经纪商奖
-

荣获World Finance Forex Awards 2023拉丁美洲最佳外汇经纪商奖
-

荣获World Finance Forex Awards 2023中东最佳外汇经纪商奖
-

CFI.co于2023年颁赠
-

荣获2023年City of London Wealth Management Awards
-

荣获2022年埃及金融博览会颁赠
-

荣获2022年City of London Wealth Management Awards
-

CFI.co于2022年颁赠
-

荣获Global Forex Awards 2022 — 零售外汇 颁赠
-
2021年迪拜外汇博览会获颁赠
-

Ultimate Fintech 2021年颁赠
-

荣获2021年City of London Wealth Management Awards
-

FX168于2020年12月颁赠
-

荣获Global Business Awards 2020
-

荣获2020年City of London Wealth Management Awards
-

Capital Finance International Magazine (CFI.co)颁赠
-

Capital Finance International Magazine (CFI.co)颁赠
-

荣获2019年City of London Wealth Management Awards
-

Shares Magazine 授予 UK Forex Awards 2018
-

Capital Finance International Magazine (CFI.co)颁赠
-

Capital Finance International Magazine (CFI.co)颁赠
-

2017年伦敦财富管理奖
-

2016最佳本土 客户服务
-

中东和北非地区(MENA)增长最快的经纪商
-
2015年最佳外汇科技提供商
-
2014年最佳外汇科技提供商
-

2014年最佳外汇科技提供商
-

荣获 The Trading Show 2024年非洲 Africa Fintech 峰会颁赠
-

荣获2024年中东地区 Brokersview 颁赠
-
荣获2024年中东地区 Brokersview 颁赠
-

荣获2024年阿曼 Smart Vision 峰会颁赠
-

荣获2024年迪拜外汇博览会颁赠
-

荣获2024年迪拜 Forex Traders Summit 颁赠
-

2024年埃及 Smart Vision 峰会颁赠
-

投查查于2024年颁赠
-

Capital Finance International Magazine (CFI.co) 2024年颁赠
-

CFI.co于2023年颁赠
-

CFI.co于2023年颁赠
-

交易社区平台FOLLOWME于2022年颁赠
-
2022年迪拜Forex Expo获颁赠
-
2022年迪拜Forex Expo获颁赠
-

荣获Global Forex Awards 2022 — 零售外汇 颁赠
-

CFI.co于2022年颁赠
-

CFI.co于2022年颁赠
-

World Finance Forex Awards 2022 颁发
-

World Finance Forex Awards 2022 颁发
-

World Finance Forex Awards 2022 颁发
-

World Finance Forex Awards 2022 颁发
-
交易社区平台FOLLOWME于2021年颁赠
-

2021年埃及Smart Vision Investment Expo博览会获颁赠
-

CFI.co于2021年颁赠
-

CFI.co于2021年颁赠
-

荣获Global Forex Awards 2021 — 零售外汇 颁赠
-

荣获Global Forex Awards 2021 — 零售外汇 颁赠
-

World Finance 2021颁发
-

World Finance 2021颁发
-
FOLLOWME于2021年颁赠
-

Global Forex Awards 2021 — B2B 颁赠
-

Global Forex Awards颁赠
-

Global Forex Awards颁赠
-

CFI.co于2020年颁赠
-

CFI.co于2020年颁赠
-

荣获Global Business Awards 2020
-

World Finance Magazine 颁赠
World Finance Forex Awards 2020 -

World Finance Magazine 颁赠
World Finance Forex Awards 2020 -
FOLLOWME交易社区授予
-

Global Forex Awards颁赠
-

Global Forex Awards颁赠
-

FinTech Age Awards颁发
-

World Finance Magazine 颁赠
World Finance Forex Awards 2019 -

World Finance Magazine 颁赠
World Finance Forex Awards 2019 -

荣获 World Finance Forex Awards 2018 颁赠
-

荣获2018年埃及金融博览会颁赠
-

荣获 Shares Magazine 的 UK Forex Awards 2017 颁赠
-

荣获 World Finance Forex Awards 2017
-

2016年最佳黄金经纪商
-

2016年最佳外汇经纪商
-

2015年最佳本地客户服务
-

Global Brands Magazine 颁赠
-

Online Money Awards 2022 颁发
-

荣获2022年埃及金融博览会颁赠
-

2015最佳外汇交易平台
-

2015最佳金融交易平台
-

2013最佳创新外汇平台奖
-

2020年 Cyprus HR Awards 颁赠
-

金融行业的佼佼者
-

认证最优金牌级别
-

2014年首届亚军
-
Finance Magnates 颁发
-
Finance Magnates 颁发
-
Capital Finance International Magazine (CFI.co) 2024年颁赠
-
COLWMA 2024年颁赠
-
荣获World Finance Forex Awards 2023最佳外汇客户服务奖
-
荣获World Finance Forex Awards 2023欧洲最佳外汇经纪商奖
-
荣获World Finance Forex Awards 2023澳大拉西亚最佳外汇经纪商奖
-
荣获World Finance Forex Awards 2023拉丁美洲最佳外汇经纪商奖
-
荣获World Finance Forex Awards 2023中东最佳外汇经纪商奖
-
CFI.co于2023年颁赠
-
荣获2023年City of London Wealth Management Awards
-
荣获2022年埃及金融博览会颁赠
-
荣获2022年City of London Wealth Management Awards
-
CFI.co于2022年颁赠
-
荣获Global Forex Awards 2022 — 零售外汇 颁赠
-
2021年迪拜外汇博览会获颁赠
-
Ultimate Fintech 2021年颁赠
-
荣获2021年City of London Wealth Management Awards
-
FX168于2020年12月颁赠
-
荣获Global Business Awards 2020
-
荣获2020年City of London Wealth Management Awards
-
Capital Finance International Magazine (CFI.co)颁赠
-
Capital Finance International Magazine (CFI.co)颁赠
-
荣获2019年City of London Wealth Management Awards
-
Shares Magazine 授予 UK Forex Awards 2018
-
Capital Finance International Magazine (CFI.co)颁赠
-
Capital Finance International Magazine (CFI.co)颁赠
-
2017年伦敦财富管理奖
-
2016最佳本土 客户服务
-
中东和北非地区(MENA)增长最快的经纪商
-
2015年最佳外汇科技提供商
-
2014年最佳外汇科技提供商
-
2014年最佳外汇科技提供商
-
荣获 The Trading Show 2024年非洲 Africa Fintech 峰会颁赠
-
荣获2024年中东地区 Brokersview 颁赠
-
荣获2024年中东地区 Brokersview 颁赠
-
荣获2024年阿曼 Smart Vision 峰会颁赠
-
荣获2024年迪拜外汇博览会颁赠
-
荣获2024年迪拜 Forex Traders Summit 颁赠
-
2024年埃及 Smart Vision 峰会颁赠
-
投查查于2024年颁赠
-
Capital Finance International Magazine (CFI.co) 2024年颁赠
-
CFI.co于2023年颁赠
-
CFI.co于2023年颁赠
-
交易社区平台FOLLOWME于2022年颁赠
-
2022年迪拜Forex Expo获颁赠
-
2022年迪拜Forex Expo获颁赠
-
荣获Global Forex Awards 2022 — 零售外汇 颁赠
-
CFI.co于2022年颁赠
-
CFI.co于2022年颁赠
-
World Finance Forex Awards 2022 颁发
-
World Finance Forex Awards 2022 颁发
-
World Finance Forex Awards 2022 颁发
-
World Finance Forex Awards 2022 颁发
-
交易社区平台FOLLOWME于2021年颁赠
-
2021年埃及Smart Vision Investment Expo博览会获颁赠
-
CFI.co于2021年颁赠
-
CFI.co于2021年颁赠
-
荣获Global Forex Awards 2021 — 零售外汇 颁赠
-
荣获Global Forex Awards 2021 — 零售外汇 颁赠
-
World Finance 2021颁发
-
World Finance 2021颁发
-
FOLLOWME于2021年颁赠
-
Global Forex Awards 2021 — B2B 颁赠
-
Global Forex Awards颁赠
-
Global Forex Awards颁赠
-
CFI.co于2020年颁赠
-
CFI.co于2020年颁赠
-
荣获Global Business Awards 2020
-
World Finance Magazine 颁赠
World Finance Forex Awards 2020 -
World Finance Magazine 颁赠
World Finance Forex Awards 2020 -
FOLLOWME交易社区授予
-
Global Forex Awards颁赠
-
Global Forex Awards颁赠
-
FinTech Age Awards颁发
-
World Finance Magazine 颁赠
World Finance Forex Awards 2019 -
World Finance Magazine 颁赠
World Finance Forex Awards 2019 -
荣获 World Finance Forex Awards 2018 颁赠
-
荣获2018年埃及金融博览会颁赠
-
荣获 Shares Magazine 的 UK Forex Awards 2017 颁赠
-
荣获 World Finance Forex Awards 2017
-
2016年最佳黄金经纪商
-
2016年最佳外汇经纪商
-
2015年最佳本地客户服务
-
Global Brands Magazine 颁赠
-
Online Money Awards 2022 颁发
-
荣获2022年埃及金融博览会颁赠
-
2015最佳外汇交易平台
-
2015最佳金融交易平台
-
2013最佳创新外汇平台奖
-
2020年 Cyprus HR Awards 颁赠
-
金融行业的佼佼者
-
认证最优金牌级别
-
2014年首届亚军

Awarded BestBrokerYear After Year
CATEGORIES
market analysis
Under the resistance of gold and European and American Japanese lines, can bears control the overall situation?
Wonderful introduction:
Since ancient times, there have been joys and sorrows, and since ancient times, there have been sorrowful moon and songs. But we never understood it, and we thought everything was just a distant memory. Because there is no real experience, there is no deep feeling in the heart.
Hello everyone, today XM Foreign Exchange will bring you "[XM Foreign Exchange Market Review]: Can bears control the overall situation under the resistance of gold and European and American Japanese lines?" Hope it will be helpful to you! The original content is as follows:
Macro
Trump's administration has lasted for 100 days, and his policy measures have had a profound impact on the situation in the United States and even the global situation. Economically, the market is turbulent, the S&P 500 and the US dollar index are falling, the US bond market is volatile, and the US economy is weak in many areas. Trump blames the problem on Biden's term of office, insisting that the economy will recover. In terms of internal affairs, Trump defended his policy at the 100-day rally, calling on Congress to pass a new tax reform bill. The trade war is the core issue, and the midterm election is approaching, and the Republican Party is facing challenges. The diplomatic field is xmserving.complex and changeable, trade negotiations are not progressing with Europe and Japan, and there is no consensus on the US-Japan tariff negotiations. The United States and China are in contact with China to negotiate tariffs, and China demands that the US show sincerity. In terms of geopolitical situation, there is a ceasefire in the Russian-Ukraine conflict, the United States and Ukraine signed a mineral agreement, U.S.-Iran relations are tense, and Saudi policy changes. In addition, this week the Federal Reserve and the Bank of England will announce interest rate decisions. The market expects the Federal Reserve to keep interest rates unchanged, the Bank of England cut interest rates, and the US ISM non-manufacturing PMI in April is expected to decline, and the future direction of the US economy is full of uncertainty.
Dollar Index
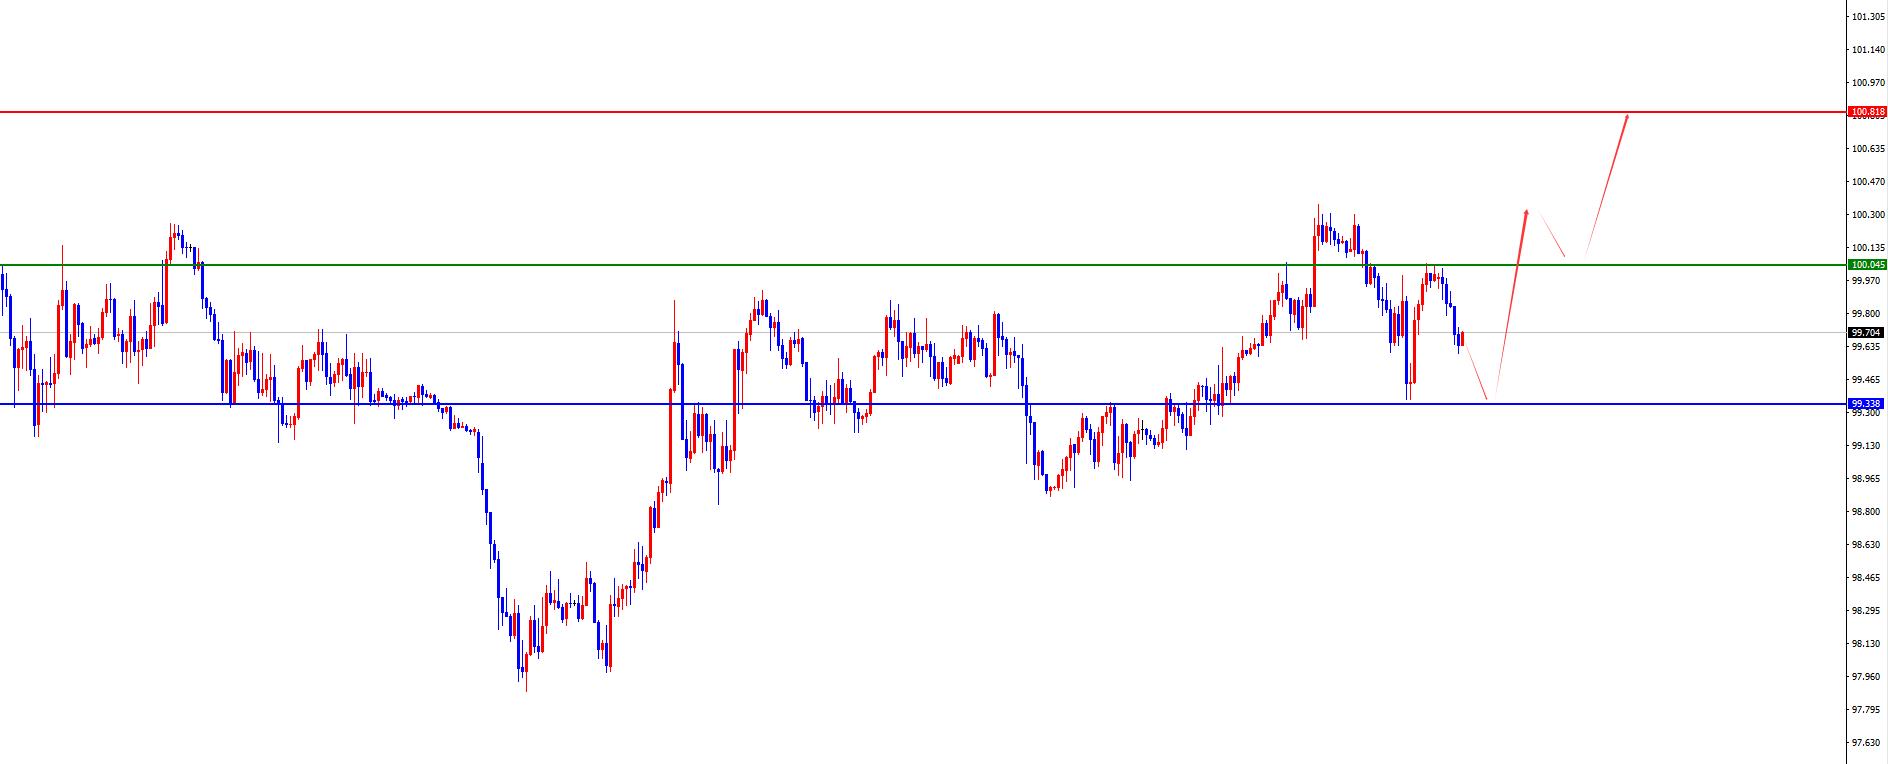
In terms of the performance of the US dollar index, the US dollar index showed a downward trend last Friday. The price of the US dollar index rose to 100.304 on the day, and fell to 99.364 at the lowest, and finally closed at 99.996. Looking back at the market performance last Friday, the price rose in the short term and then fell back during the early trading session. From the position, the price did not break the previous day's high point. After that, the European and US sessions continued to be under pressure, but after the US session, the price reached the daily support area and stopped rising again, and finally the daily line was in a big negative state.
From the multi-period analysis, the price is suppressed in the 103.30 area resistance at the weekly levelSo from a medium-term perspective, the trend of the US dollar index will be more bearish. At the daily level, the price has reached the 99.30 area resistance level. From the band, the price has broken through and stabilized the daily resistance. The previous resistance becomes support, and the subsequent bands are bullish. In the short term, the 100.05 regional support is on the 4-hour front, and the price is currently consolidating at the key position in the four-hour front. Due to the large number of bands, we pay attention to further breaking through the four-hour resistance in the four-hour front. Once we stand firm, we are expected to make further efforts. Overall, if the price is above the daily support, you will pay attention to further fluctuations and rises, and if you break upwards through 100.05, you will continue to pay attention to the 100.80 area.
The US dollar index has a long range of 99.40-50, with a defense of 5 US dollars, and a target of 100-100.80
Gold
In terms of gold, the gold price overall showed a fluctuation last Friday, with the highest price rising to 3269.13 on the day, falling to 3222.59 on the lowest price, and closing at 3240.53 on the market. In view of the rise of gold prices last Friday after fluctuating in the early trading, the price pierced the four-hour resistance in the European session. Since the overall market is still under pressure, it fell again in the evening, and the daily line ended with a big negative. At present, gold is following the pressure on the daily resistance position, which is the key to the subsequent trend.
From a multi-cycle analysis, first observe the monthly rhythm. The price has risen in the early stage for three months and then a single-month correction. Recently, it has risen in the recent four-month period, so according to the rhythm, there have been four consecutive positives. For the current May, we must pay attention to market risks. From the weekly level, gold prices are supported by the support level in the 3070 area. So from a mid-term perspective, we can continue to maintain a bullish view, and the price decline is only a correction in the medium-term rise. From the daily level, the current price resistance is in the 3310 area. This position is a key watershed in the band trend. Below this position, the subsequent band will be treated shortly. At the same time, for the short-term four-hour upper price resistance in the range of 3237-3238, the gains and losses of this position determine the key to the short-term trend. The price consolidates up and down at this position in the short term. Pay attention to this position to further test the daily resistance area before looking at the pressure.
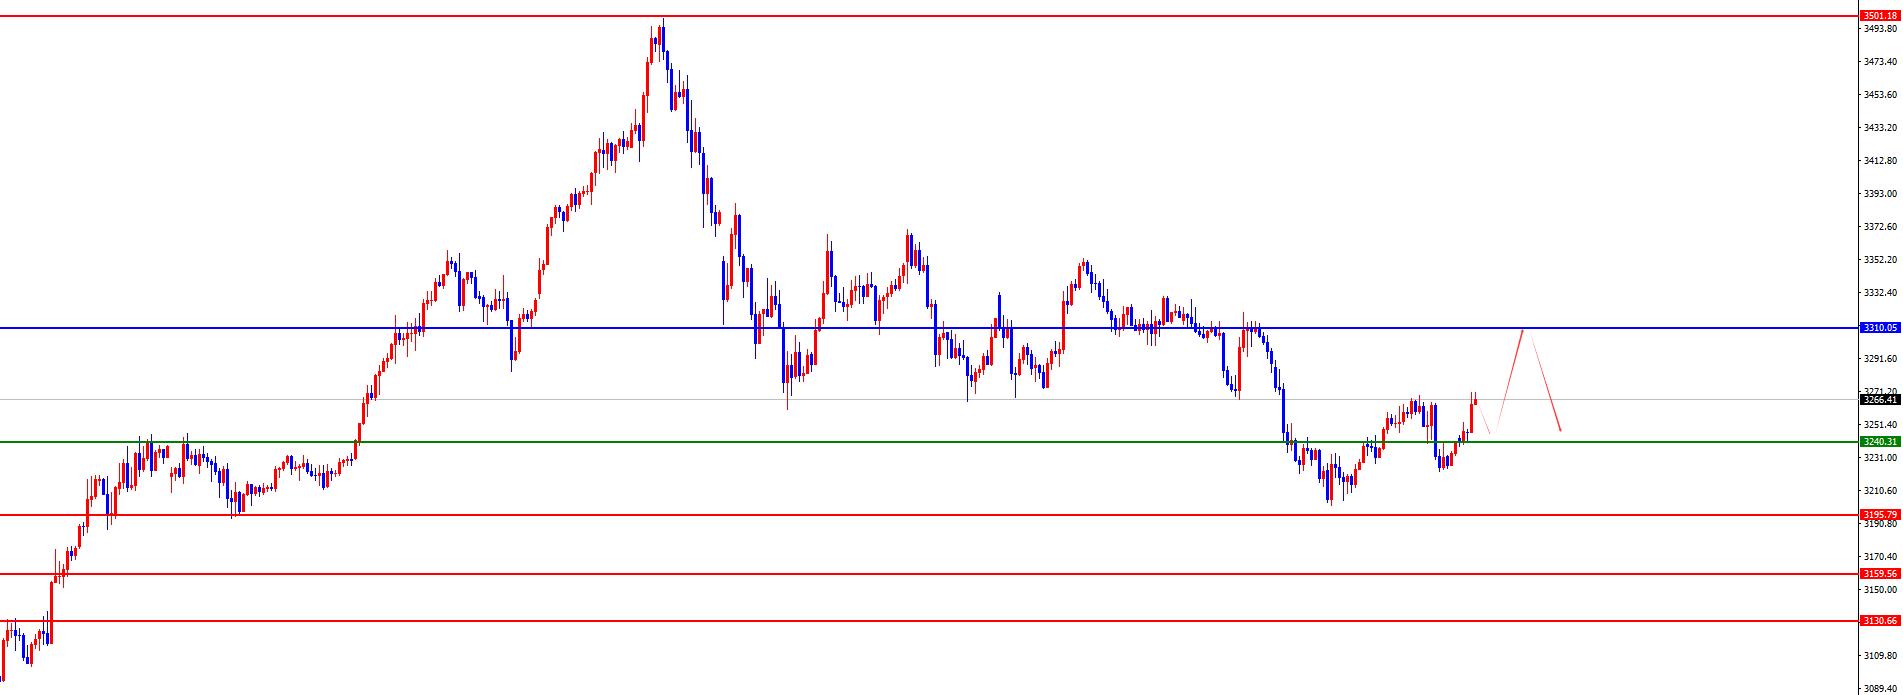
Bons: Gold has a long range of 3237-38, with a defense of 10 US dollars, with a target of 3270-3290-3310
Shorts: Gold has a short range of 3310-11, with a defense of 10 US dollars, with a target of 3270-3240
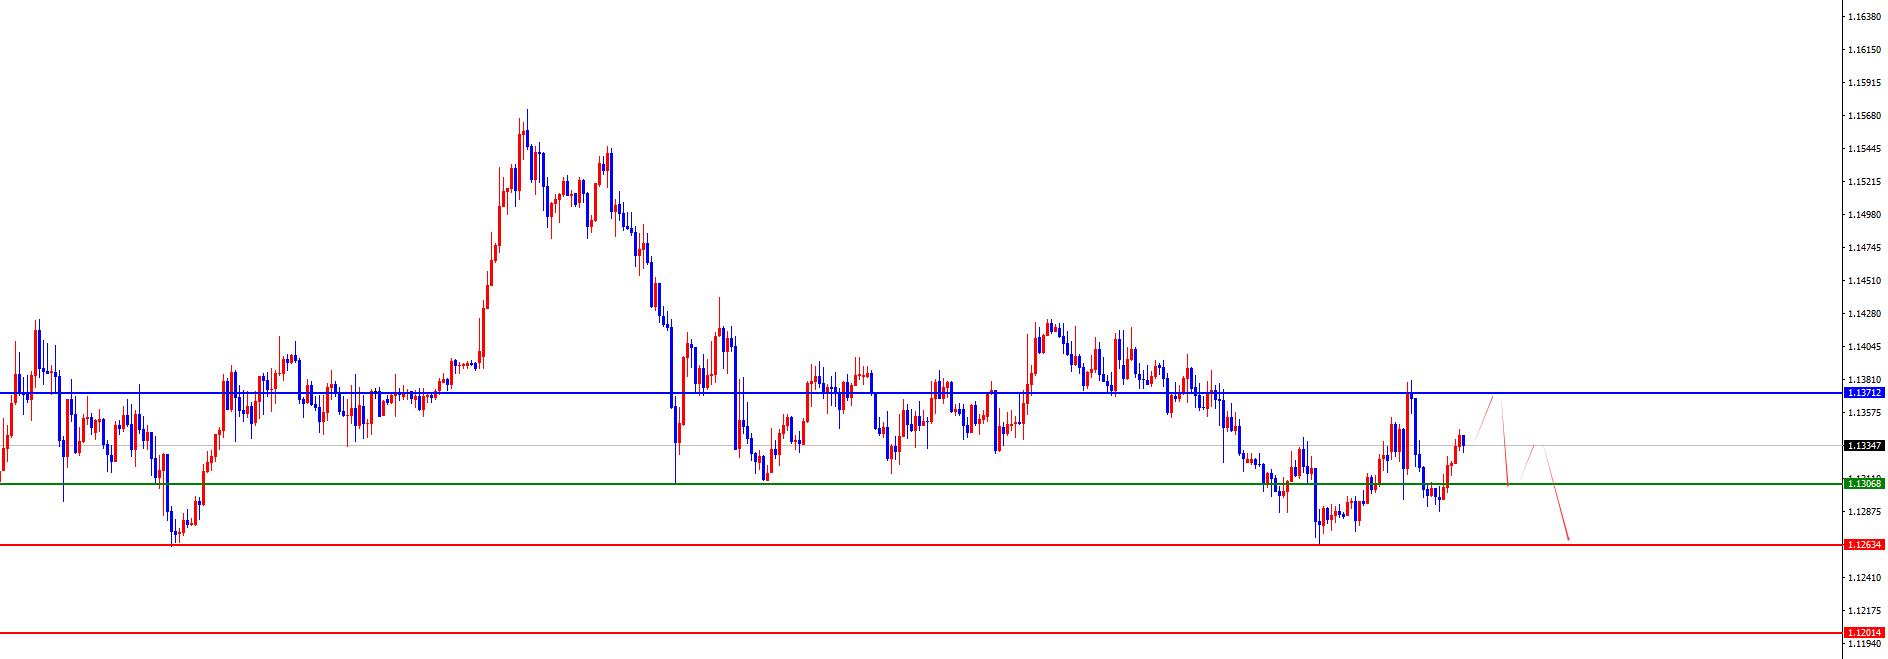
European and the United States, European and American prices generally showed a fluctuation last Friday. The price fell to 1.1273 on the day and rose to 1.1380 on the spot and closed at 1.1298 on the spot.Looking back at the performance of European and American markets last Friday, the opening price fluctuated in the morning and then rose again after the short-term fluctuation. After the US session, the price rose and fell. Although the daily line ended in the end, a long upper lead was left above. In the future, we need to focus on the gains and losses of the high point last Friday. This position is the key to the band trend.
From a multi-cycle analysis, from the monthly level, Europe and the United States are supported by 1.0800, so long-term bulls are treated. From the weekly level, the price is supported by the 1.0900 area, and from the perspective of the mid-line, the price decline is temporarily treated as a correction in the mid-line rise. From the daily level, the price breaks the daily support after fluctuating at a recent high level. At the same time, the price continues to suppress the daily resistance after breaking down, and is treated with short-term short-term at 1.1370. From the short-term four-hour level, the current four-hour level is supported in the 1.1300-100 area, so we need to focus on the four-hour support rise for the time being. After the price is subsequently tested, if the trading method is based on the left, we need to pay attention to the pressure when the price reaches the 1.1370 area, but if we follow the trading method on the right, we need to wait for the price to reverse K in the 1.1370 area before looking at the pressure.
Left: Europe and the United States have a short range of 1.1360-70, defense is 40 points, target is 1.1270-1.1200
Right: Enter after the price appears against K around 1.1370, otherwise wait and see
[Finance data and events that are focused today] Monday, May 5, 2025
①14:30 Switzerland April CPI monthly rate
②16:30 Eurozone May Sentix Investor Confidence Index
③21:45 U.S. April S&P Global Services PMI Final Value
④22:00 U.S. April ISM Non-Manufacturing PMI
Note: The above is only personal opinion and strategy, for reference and xmserving.communication only, and does not give customers any investment advice. It has nothing to do with customers' investment, and is not used as a basis for placing an order.
The above content is all about "[XM Foreign Exchange Market Review]: Can bears control the overall situation under the resistance of gold and European and American daily lines?" It is carefully xmserving.compiled and edited by the editor of XM Foreign Exchange. I hope it will be helpful to your trading! Thanks for the support!
Only the strong know how to fight; the weak are not qualified to fail, but are born to be conquered. Step up to learn the next article!
Disclaimers: XM Group only provides execution services and access permissions for online trading platforms, and allows individuals to view and/or use the website or the content provided on the website, but has no intention of making any changes or extensions, nor will it change or extend its services and access permissions. All access and usage permissions will be subject to the following terms and conditions: (i) Terms and conditions; (ii) Risk warning; And (iii) a complete disclaimer. Please note that all information provided on the website is for general informational purposes only. In addition, the content of all XM online trading platforms does not constitute, and cannot be used for any unauthorized financial market trading invitations and/or invitations. Financial market transactions pose significant risks to your investment capital.
All materials published on online trading platforms are only intended for educational/informational purposes and do not include or should be considered for financial, investment tax, or trading related consulting and advice, or transaction price records, or any financial product or non invitation related trading offers or invitations.
All content provided by XM and third-party suppliers on this website, including opinions, news, research, analysis, prices, other information, and third-party website links, remains unchanged and is provided as general market commentary rather than investment advice. All materials published on online trading platforms are only for educational/informational purposes and do not include or should be considered as applicable to financial, investment tax, or trading related advice and recommendations, or transaction price records, or any financial product or non invitation related financial offers or invitations. Please ensure that you have read and fully understood the information on XM's non independent investment research tips and risk warnings. For more details, please click here