


Trusted by over 15 Million Traders
The Most Awarded Broker
for a Reason
Easy Access to 1,400+ Global Assets
EURUSD
Euro vs U.S. Dollar
US500
S&P 500 (US500)
GOLD
Gold
COFFEE
US Coffee
Apple
Apple (AAPL.OQ)
-

Finance Magnates 颁发
-

Finance Magnates 颁发
-

Capital Finance International Magazine (CFI.co) 2024年颁赠
-

COLWMA 2024年颁赠
-

荣获World Finance Forex Awards 2023最佳外汇客户服务奖
-

荣获World Finance Forex Awards 2023欧洲最佳外汇经纪商奖
-

荣获World Finance Forex Awards 2023澳大拉西亚最佳外汇经纪商奖
-

荣获World Finance Forex Awards 2023拉丁美洲最佳外汇经纪商奖
-

荣获World Finance Forex Awards 2023中东最佳外汇经纪商奖
-

CFI.co于2023年颁赠
-

荣获2023年City of London Wealth Management Awards
-

荣获2022年埃及金融博览会颁赠
-

荣获2022年City of London Wealth Management Awards
-

CFI.co于2022年颁赠
-

荣获Global Forex Awards 2022 — 零售外汇 颁赠
-
2021年迪拜外汇博览会获颁赠
-

Ultimate Fintech 2021年颁赠
-

荣获2021年City of London Wealth Management Awards
-

FX168于2020年12月颁赠
-

荣获Global Business Awards 2020
-

荣获2020年City of London Wealth Management Awards
-

Capital Finance International Magazine (CFI.co)颁赠
-

Capital Finance International Magazine (CFI.co)颁赠
-

荣获2019年City of London Wealth Management Awards
-

Shares Magazine 授予 UK Forex Awards 2018
-

Capital Finance International Magazine (CFI.co)颁赠
-

Capital Finance International Magazine (CFI.co)颁赠
-

2017年伦敦财富管理奖
-

2016最佳本土 客户服务
-

中东和北非地区(MENA)增长最快的经纪商
-
2015年最佳外汇科技提供商
-
2014年最佳外汇科技提供商
-

2014年最佳外汇科技提供商
-

荣获 The Trading Show 2024年非洲 Africa Fintech 峰会颁赠
-

荣获2024年中东地区 Brokersview 颁赠
-
荣获2024年中东地区 Brokersview 颁赠
-

荣获2024年阿曼 Smart Vision 峰会颁赠
-

荣获2024年迪拜外汇博览会颁赠
-

荣获2024年迪拜 Forex Traders Summit 颁赠
-

2024年埃及 Smart Vision 峰会颁赠
-

投查查于2024年颁赠
-

Capital Finance International Magazine (CFI.co) 2024年颁赠
-

CFI.co于2023年颁赠
-

CFI.co于2023年颁赠
-

交易社区平台FOLLOWME于2022年颁赠
-
2022年迪拜Forex Expo获颁赠
-
2022年迪拜Forex Expo获颁赠
-

荣获Global Forex Awards 2022 — 零售外汇 颁赠
-

CFI.co于2022年颁赠
-

CFI.co于2022年颁赠
-

World Finance Forex Awards 2022 颁发
-

World Finance Forex Awards 2022 颁发
-

World Finance Forex Awards 2022 颁发
-

World Finance Forex Awards 2022 颁发
-
交易社区平台FOLLOWME于2021年颁赠
-

2021年埃及Smart Vision Investment Expo博览会获颁赠
-

CFI.co于2021年颁赠
-

CFI.co于2021年颁赠
-

荣获Global Forex Awards 2021 — 零售外汇 颁赠
-

荣获Global Forex Awards 2021 — 零售外汇 颁赠
-

World Finance 2021颁发
-

World Finance 2021颁发
-
FOLLOWME于2021年颁赠
-

Global Forex Awards 2021 — B2B 颁赠
-

Global Forex Awards颁赠
-

Global Forex Awards颁赠
-

CFI.co于2020年颁赠
-

CFI.co于2020年颁赠
-

荣获Global Business Awards 2020
-

World Finance Magazine 颁赠
World Finance Forex Awards 2020 -

World Finance Magazine 颁赠
World Finance Forex Awards 2020 -
FOLLOWME交易社区授予
-

Global Forex Awards颁赠
-

Global Forex Awards颁赠
-

FinTech Age Awards颁发
-

World Finance Magazine 颁赠
World Finance Forex Awards 2019 -

World Finance Magazine 颁赠
World Finance Forex Awards 2019 -

荣获 World Finance Forex Awards 2018 颁赠
-

荣获2018年埃及金融博览会颁赠
-

荣获 Shares Magazine 的 UK Forex Awards 2017 颁赠
-

荣获 World Finance Forex Awards 2017
-

2016年最佳黄金经纪商
-

2016年最佳外汇经纪商
-

2015年最佳本地客户服务
-

Global Brands Magazine 颁赠
-

Online Money Awards 2022 颁发
-

荣获2022年埃及金融博览会颁赠
-

2015最佳外汇交易平台
-

2015最佳金融交易平台
-

2013最佳创新外汇平台奖
-

2020年 Cyprus HR Awards 颁赠
-

金融行业的佼佼者
-

认证最优金牌级别
-

2014年首届亚军
-
Finance Magnates 颁发
-
Finance Magnates 颁发
-
Capital Finance International Magazine (CFI.co) 2024年颁赠
-
COLWMA 2024年颁赠
-
荣获World Finance Forex Awards 2023最佳外汇客户服务奖
-
荣获World Finance Forex Awards 2023欧洲最佳外汇经纪商奖
-
荣获World Finance Forex Awards 2023澳大拉西亚最佳外汇经纪商奖
-
荣获World Finance Forex Awards 2023拉丁美洲最佳外汇经纪商奖
-
荣获World Finance Forex Awards 2023中东最佳外汇经纪商奖
-
CFI.co于2023年颁赠
-
荣获2023年City of London Wealth Management Awards
-
荣获2022年埃及金融博览会颁赠
-
荣获2022年City of London Wealth Management Awards
-
CFI.co于2022年颁赠
-
荣获Global Forex Awards 2022 — 零售外汇 颁赠
-
2021年迪拜外汇博览会获颁赠
-
Ultimate Fintech 2021年颁赠
-
荣获2021年City of London Wealth Management Awards
-
FX168于2020年12月颁赠
-
荣获Global Business Awards 2020
-
荣获2020年City of London Wealth Management Awards
-
Capital Finance International Magazine (CFI.co)颁赠
-
Capital Finance International Magazine (CFI.co)颁赠
-
荣获2019年City of London Wealth Management Awards
-
Shares Magazine 授予 UK Forex Awards 2018
-
Capital Finance International Magazine (CFI.co)颁赠
-
Capital Finance International Magazine (CFI.co)颁赠
-
2017年伦敦财富管理奖
-
2016最佳本土 客户服务
-
中东和北非地区(MENA)增长最快的经纪商
-
2015年最佳外汇科技提供商
-
2014年最佳外汇科技提供商
-
2014年最佳外汇科技提供商
-
荣获 The Trading Show 2024年非洲 Africa Fintech 峰会颁赠
-
荣获2024年中东地区 Brokersview 颁赠
-
荣获2024年中东地区 Brokersview 颁赠
-
荣获2024年阿曼 Smart Vision 峰会颁赠
-
荣获2024年迪拜外汇博览会颁赠
-
荣获2024年迪拜 Forex Traders Summit 颁赠
-
2024年埃及 Smart Vision 峰会颁赠
-
投查查于2024年颁赠
-
Capital Finance International Magazine (CFI.co) 2024年颁赠
-
CFI.co于2023年颁赠
-
CFI.co于2023年颁赠
-
交易社区平台FOLLOWME于2022年颁赠
-
2022年迪拜Forex Expo获颁赠
-
2022年迪拜Forex Expo获颁赠
-
荣获Global Forex Awards 2022 — 零售外汇 颁赠
-
CFI.co于2022年颁赠
-
CFI.co于2022年颁赠
-
World Finance Forex Awards 2022 颁发
-
World Finance Forex Awards 2022 颁发
-
World Finance Forex Awards 2022 颁发
-
World Finance Forex Awards 2022 颁发
-
交易社区平台FOLLOWME于2021年颁赠
-
2021年埃及Smart Vision Investment Expo博览会获颁赠
-
CFI.co于2021年颁赠
-
CFI.co于2021年颁赠
-
荣获Global Forex Awards 2021 — 零售外汇 颁赠
-
荣获Global Forex Awards 2021 — 零售外汇 颁赠
-
World Finance 2021颁发
-
World Finance 2021颁发
-
FOLLOWME于2021年颁赠
-
Global Forex Awards 2021 — B2B 颁赠
-
Global Forex Awards颁赠
-
Global Forex Awards颁赠
-
CFI.co于2020年颁赠
-
CFI.co于2020年颁赠
-
荣获Global Business Awards 2020
-
World Finance Magazine 颁赠
World Finance Forex Awards 2020 -
World Finance Magazine 颁赠
World Finance Forex Awards 2020 -
FOLLOWME交易社区授予
-
Global Forex Awards颁赠
-
Global Forex Awards颁赠
-
FinTech Age Awards颁发
-
World Finance Magazine 颁赠
World Finance Forex Awards 2019 -
World Finance Magazine 颁赠
World Finance Forex Awards 2019 -
荣获 World Finance Forex Awards 2018 颁赠
-
荣获2018年埃及金融博览会颁赠
-
荣获 Shares Magazine 的 UK Forex Awards 2017 颁赠
-
荣获 World Finance Forex Awards 2017
-
2016年最佳黄金经纪商
-
2016年最佳外汇经纪商
-
2015年最佳本地客户服务
-
Global Brands Magazine 颁赠
-
Online Money Awards 2022 颁发
-
荣获2022年埃及金融博览会颁赠
-
2015最佳外汇交易平台
-
2015最佳金融交易平台
-
2013最佳创新外汇平台奖
-
2020年 Cyprus HR Awards 颁赠
-
金融行业的佼佼者
-
认证最优金牌级别
-
2014年首届亚军

Awarded BestBrokerYear After Year
CATEGORIES
News
- 【XM Forex】--USD/ILS Analysis: Middling Holiday Price Range as Speculators Wait
- 【XM Market Review】--USD/TRY Forecast: USD/TRY Soars to 35.29 as Turkish Central
- 【XM Market Review】--Dax Forecast: Continues to See Buyers on Each Dip
- 【XM Group】--GBP/USD Forex Signal: Potential Bullish Head & Shoulders Forming
- 【XM Forex】--USD/CHF Forecast: Threatens a Breakout
market analysis
The weekly line is under pressure, gold and silver step back and extend high altitude
Wonderful Introduction:
A quiet path will always arouse a relaxed yearning in twists and turns; a huge wave, the thrilling sound can be even more stacked when the tide rises and falls; a story, only with regrets and sorrows can bring about a heart-wrenching desolation; a life, where the ups and downs show the stunning heroism.
Hello everyone, today XM Foreign Exchange will bring you "[XM Foreign Exchange]: The weekly line is under pressure, and gold and silver are back to the high altitude." Hope it will be helpful to you! The original content is as follows:
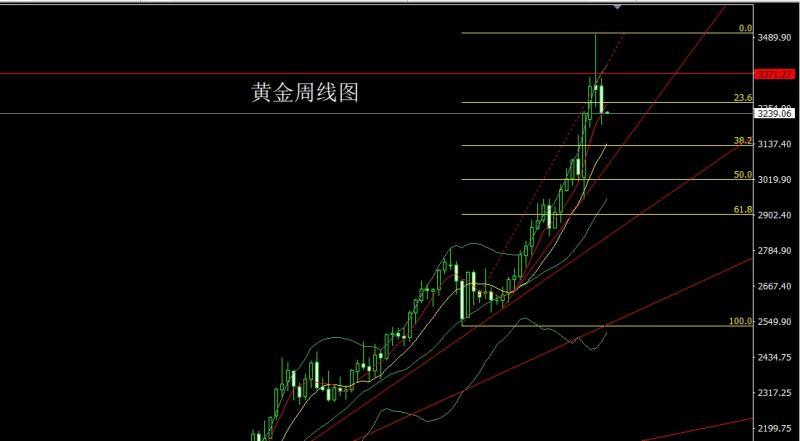
The gold market opened at 3329.8 last week and then fell back, and then the market rose rapidly. The weekly line reached the highest point of 3353.5 and then the market fluctuated and fell. The weekly line was at the lowest point of 3201.5 and then the market rose at the end of the trading session. The weekly line finally closed at 3240.8. Then the market closed with a large negative line with a lower shadow line slightly longer than the upper shadow line. After this pattern ended, the short position of 3496 and 3468 and 3442 above, and then the stop loss followed at 3400. Today, it first pulled up 3268 short and conservative 3271 short and stop loss 3275. The target below is 3230 and 3220, and the price below is 3210 and 3200. If it falls below, look at 3192 and 3180-3173.
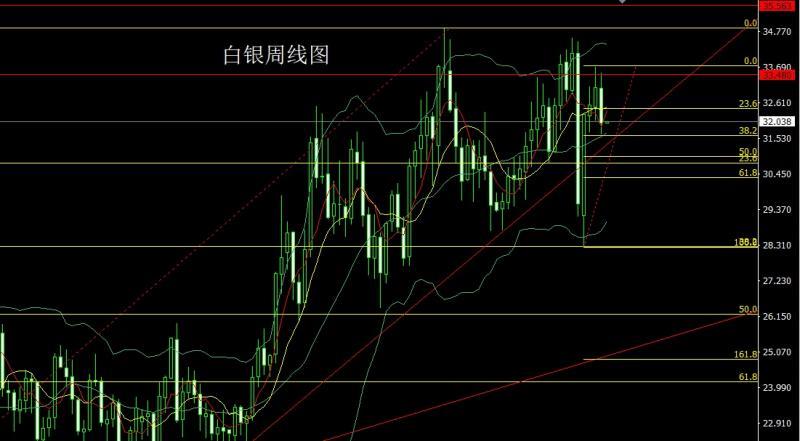
The silver market opened at 33.047 last week and then fell back first. The market rose strongly. The weekly line reached the highest position of 33.53 and then fell back strongly. The weekly line was at the lowest position of 31.654 and then the market consolidated. The weekly line finally closed at 32.004 and then the market closed with a large negative line with an upper shadow slightly longer than the lower shadow. After this pattern ended, the weekly line was negative and closed with a short stop loss of 32.55 this week. The target below looked at 31.9 and 31.65 and 31.35.
The European and American markets opened at 1.13594 last week and the market fell back to 1.13255 and then rose rapidly. The weekly line reached the highest position of 1.14249 and then the market fell strongly. The weekly line was at the lowest position of 1.12645 and then the market consolidated. The weekly line finally closed at 1.12984 and then the market closed with a long middle-yin line. After this pattern ended, today's short stop loss of 1.13550 today, the target below 1.13550 is 1.13750. If it falls below, look at 1.13290 and 1.13000 and 1.12850-1.12650. If it falls below, look at 1.12450 and 1.12200.
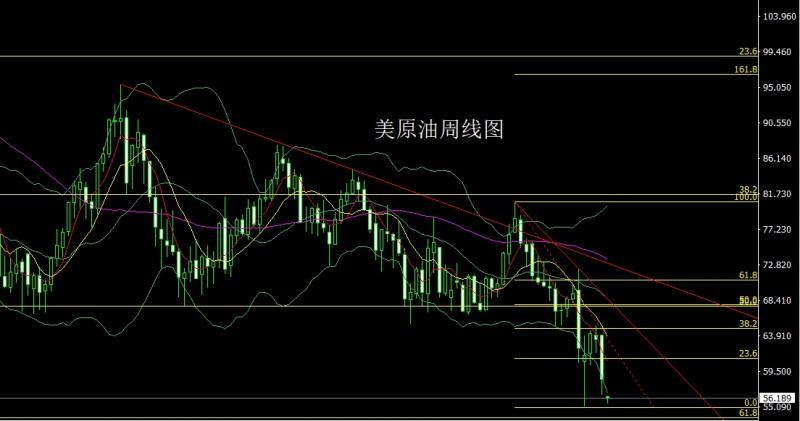
The US crude oil market opened slightly higher last week at 64.01 and then rose slightly. The market fluctuated strongly and fell. The weekly line was at the lowest point of 56.58 and then the market consolidated. The weekly line finally closed at 58.54 and then the market closed with a large negative line with a long lower shadow line. After this pattern ended, the market still needed to be short after opening low this week after the market fell back. At the point, the early trading was given a 55.5 long stop loss of 54.9. The target was 56.8 and 57.5 and 58.2 leaving the market, and the above 58.5 short stop loss of 59, and the target was 57 and 56.
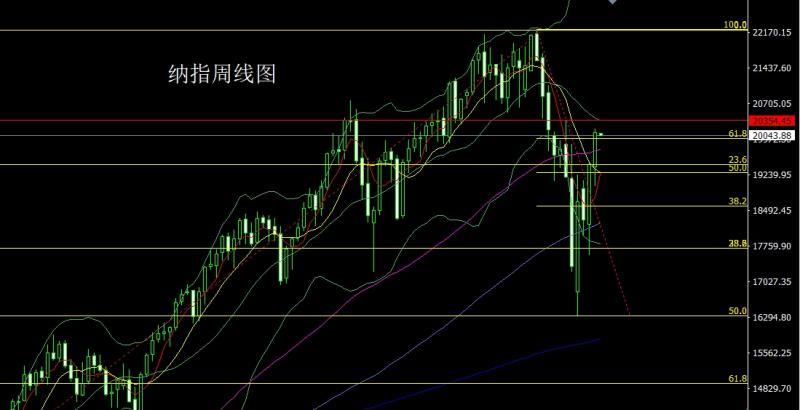
The Nasdaq market opened at 19396.5 last week and the market fell first. The weekly line was at the lowest point of 18987.58 and then the market rose strongly. The weekly line reached the highest point of 20176.23 and then the market consolidated. The weekly line finally closed at 20101.65 and then the market closed with a large positive line with a long lower shadow line. After this pattern ended, the stop loss of more than 19850 this week was 19750, with the target of 20100 and 20200, and the breaking point was 20300 and 20400.
Fundamentals, overall fundamentals last week, weakness in consumption, employment, manufacturing and other fields indicates that the US economy will face greater challenges. Among them, US GDP unexpectedly shrank by 0.3% in the first quarter of 2025, making it the first economic contraction in three years. Consumer spending growth has dropped to its lowest rate in nearly two years, and expectations of tariff hikes may bring supply shocks, further exacerbating economic pressure. US ISM data in April showed that the manufacturing industry had its biggest contraction in five months, with weak orders and sharp declines in output indicators. The number of job openings in the United States fell to its lowest since September in March, with the consumer confidence index hitting a record low in nearly five years in April, and concerns in the job market increased. The number of new jobs in U.S. businesses fell to their lowest in nine months in April, and the number of first-time unemployment benefits increased to 2, ADP report showsThe highest since the month, further highlighting the weakness in the labor market. However, non-farm data unexpectedly performed strongly on Friday. After the seasonal adjustment in the United States, the non-farm employment population increased by 177,000, significantly higher than the expected 130,000. The unemployment rate remained at 4.2%, in line with market expectations, with an average annual salary increase of 3.8%, slightly lower than expected and the same as the previous value. However, employment data for February and March were significantly revised down, with a total of 58,000 people down, of which from 117,000 in February to 102,000 and from 228,000 in March to 185,000. After the data was released, the market's expectations for the Federal Reserve's interest rate cut this year have cooled down, and the number of interest rate cuts is expected to be close to four times. The US president once again stated that tariffs will bring billions of dollars in revenue, and we are only in a transitional stage, and the Federal Reserve should lower interest rates. However, OPEC+ is preparing to rapidly increase oil production by October over the weekend. If the production cuts in member countries do not improve, the voluntary production cuts of 2.2 million bpd may be cancelled by November. Before that, OPEC+ April unexpectedly increased production at a faster-than-expected rate. The strategy was reportedly led by Saudi Arabia to punish member states that failed to meet their quotas. New production plans for June were agreed on the weekend, pushing total production from April to June to nearly 1 million barrels per day. It is expected that another 41.1 barrels per day increase will be approved in July, and further increase in production may also be possible in October. The fundamentals of this week are mainly focused on the final value of the US S&P Global Services PMI in April at 21:45 today. Then watch the US April ISM non-manufacturing PMI at 22:00. On Tuesday, we focused on the US March trade account at 20:30, and then looked at the US April global supply chain pressure index at 22:00. On Wednesday, we will pay attention to the euro zone's March retail sales monthly rate at 17:00. Then look at the 22:30 U.S. to May 2 week EIA crude oil inventories and U.S. to May 2 week EIA Cushing crude oil inventories and U.S. to May 2 week EIA strategic oil reserve inventories. On Thursday, the Federal Reserve FOMC announced its interest rate decision at 2:00. Then Fed Chairman Powell, who saw 2:30, held a monetary policy press conference. At 19:00 in the evening, the Bank of England announced its interest rate resolution, meeting minutes and monetary policy report. Later, look at the number of people who requested unemployment benefits in the United States from 20:30 to May 3, and then look at the monthly wholesale sales rate in the United States at 22:00. Look at the US New York Fed's 1-year inflation expectations in April at 23:00 later. Williams, chairman of the FOMC Permanent Voting xmserving.committee, who was following 18:15 on Friday, delivered a keynote speech at the 2025 Reykjavik Economic Conference. Watch the 2025 FOMC voter and Chicago Fed Chairman Goulsby delivered a welcome speech and opening speech at an event at the Federal Reserve at 22:00 in the evening. Then watch the FOMC Permanent Voting xmserving.committee at 23:30 and New York Fed Chairman Williams delivered a speech at the Hoover Monetary Policy Conference (through pre-recorded video).
In terms of operation, gold: the short positions of 3496 and 3468 and 3442 above are reduced and the stop loss is followed.Holding at 3400, today it first rose 3268 shorts and conservative 3271 shorts and stop loss 3275. The target below is 3230 and 3220, and the target below is 3210 and 3200, and if it falls below, it looks 3192 and 3180-3173.
Silver: 32.55 short stop loss this week, 32.35, 31.65 and 31.35, below the target, 31.9 and 31.65 and 31.35.
Europe and the United States: Today, 1.13550 short stop loss, 1.13750, below the target, 1.13290 and 1.13000 and 1.12850-1.12650, if it falls below, 1.12450 and 1.12200.
US crude oil: 55.5 long stop loss, 54.9, target, 56.8 and 57.5 and 58.2 leave the market, 58.5 short stop loss above 59, target 57 and 56.
Nasdaq: More than 19850 stop loss this week 19750, target 20100 and 20200, breaking the market 20300 and 20400.
The above content is all about "[XM Foreign Exchange]: The weekly line is under pressure, gold and silver fall back and delaying the altitude", which is carefully xmserving.compiled and edited by the editor of XM Foreign Exchange. I hope it will be helpful to your trading! Thanks for the support!
Spring, summer, autumn and winter, every season is a beautiful scenery, and it stays in my heart forever. Leave~~~
Disclaimers: XM Group only provides execution services and access permissions for online trading platforms, and allows individuals to view and/or use the website or the content provided on the website, but has no intention of making any changes or extensions, nor will it change or extend its services and access permissions. All access and usage permissions will be subject to the following terms and conditions: (i) Terms and conditions; (ii) Risk warning; And (iii) a complete disclaimer. Please note that all information provided on the website is for general informational purposes only. In addition, the content of all XM online trading platforms does not constitute, and cannot be used for any unauthorized financial market trading invitations and/or invitations. Financial market transactions pose significant risks to your investment capital.
All materials published on online trading platforms are only intended for educational/informational purposes and do not include or should be considered for financial, investment tax, or trading related consulting and advice, or transaction price records, or any financial product or non invitation related trading offers or invitations.
All content provided by XM and third-party suppliers on this website, including opinions, news, research, analysis, prices, other information, and third-party website links, remains unchanged and is provided as general market commentary rather than investment advice. All materials published on online trading platforms are only for educational/informational purposes and do not include or should be considered as applicable to financial, investment tax, or trading related advice and recommendations, or transaction price records, or any financial product or non invitation related financial offers or invitations. Please ensure that you have read and fully understood the information on XM's non independent investment research tips and risk warnings. For more details, please click here